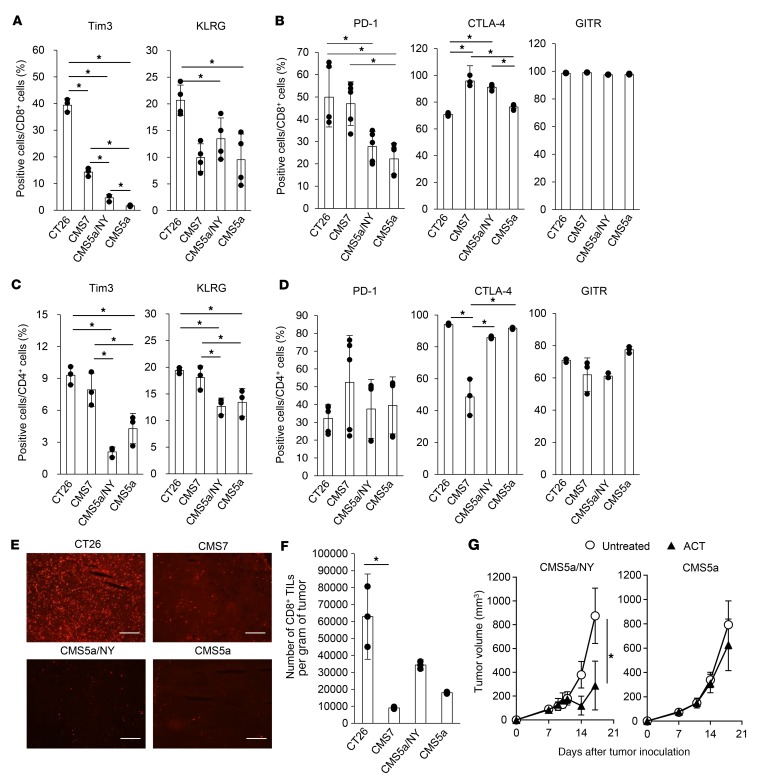
Figure 2. TIL activation and a systemic T cell response do not correlate with sensitivity to checkpoint inhibition.
(A and B) Expression of Tim3, KLRG, PD-1, CTLA-4, and GITR on CD8+ TILs from the indicated tumors was determined by flow cytometry 7 days after tumor inoculation (n = 3–4 per group). *P < 0.05, by 2-factor factorial ANOVA followed by Tukey-Kramer post hoc analysis. (C and D) The experiment was performed as in A, but on CD4+ TILs. *P < 0.05, by 2-factor factorial ANOVA followed by Tukey-Kramer post hoc analysis. The experiments were repeated 3 times with similar results. (E) PD-1 expression was also analyzed by immunohistochemistry. Scale bars: 200 μm. (F) The number of CD8+ TILs was quantified in each tumor (n = 3 per group). *P < 0.05, by 2-factor factorial ANOVA followed by Tukey-Kramer post hoc analysis. The experiments were repeated 2 times with similar results. (G) CD8+ T cells (2 × 10⁶) isolated from DUC18 mice were infused into CMS5a/NY or CMS5a tumor–bearing mice on day 7 (shown as ACT), and the tumor size was monitored (n = 5 mice per group). *P < 0.05, by Mann-Whitney U test. The experiments were repeated 3 times with similar results.

