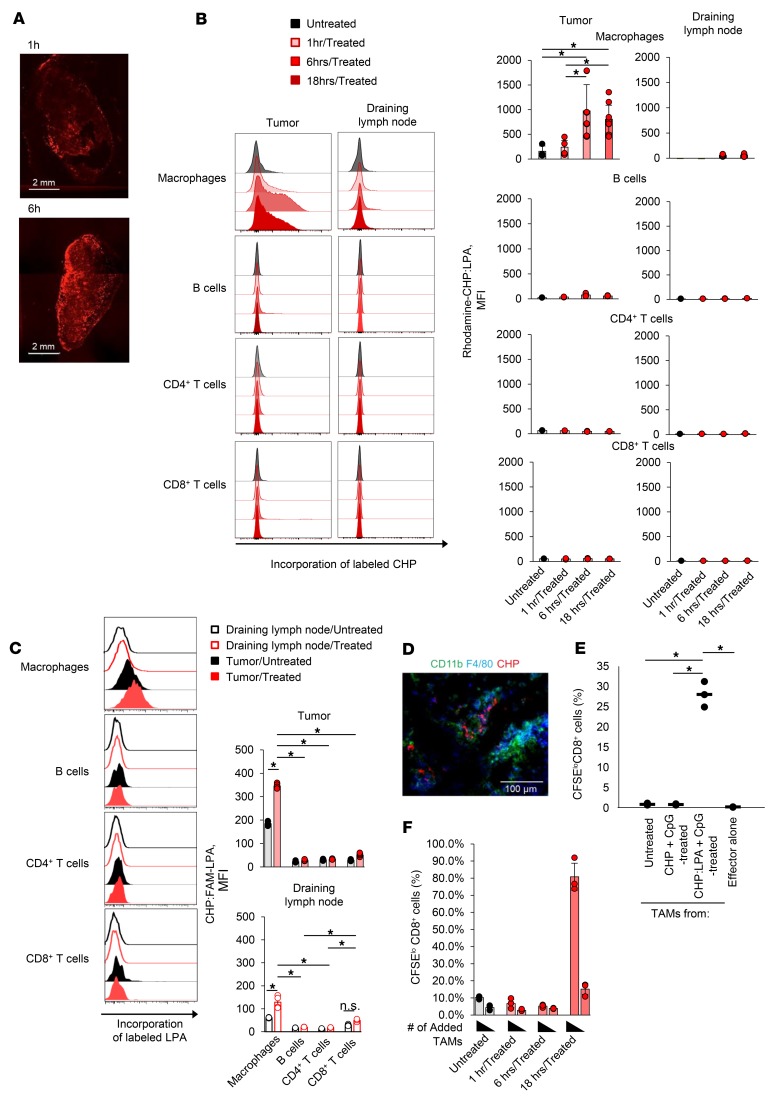
Figure 5. Targeted antigen delivery using CHP nanogel improves the antigen-presenting activity of TAMs.
(A) CMS5a tumor–bearing BALB/c mice were intravenously injected with rhodamine-CHP:LPA, and 1 hour or 6 hours later, tumors were removed. The distribution of rhodamine-CHP in the tumor was observed using confocal laser microscopy. Scale bars: 2 mm. (B) CMS5a tumor–bearing BALB/c mice were intravenously injected with the rhodamine-CHP:LPA complex, and 1 hour, 6 hours, or 18 hours later, immune cells including CD11b+F4/80+ macrophages, B cells, CD8+ T cells, and CD4+ T cells in the tumor or the tumor-draining lymph node were isolated (n = 4 per group). The uptake of labeled CHP:LPA in these cells was measured by flow cytometry. Histograms show representative data for CHP:LPA incorporation. *P < 0.05, by2-factor factorial ANOVA followed by Tukey-Kramer post hoc analysis.(C) CMS5a tumor–bearing BALB/c mice were intravenously injected with the CHP:FAM-LPA complex, and 18 hours later, the uptake of CHP:FAM-LPA in these cells was measured using flow cytometry (n = 3 mice per group). Histograms show representative data for CHP:LPA incorporation. *P < 0.05, by 2-factor factorial ANOVA followed by Tukey-Kramer post hoc analysis. The experiments were repeated 3 times with similar results. (D) CMS5a tumor–bearing BALB/c mice were treated as in A, and 6 hours later, cryosections of tumor were prepared. Incorporation of rhodamine-CHP:LPA into CD11b+F4/80+ TAMs was observed by immunohistochemistry. Scale bar: 100 μm. (E and F) The complex of CHP with 9m-containing LPA (50 μg) was intravenously injected with CpG ODN (50 μg) into BALB/c mice. After 1 hour, 6 hours, and 18 hours, TAMs were isolated and cocultured for 72 hours as antigen-presenting cells with DUC18 CD8+ T cells as responder cells. Antigen-dependent proliferation of DUC18 CD8+ T cells was measured using a CFSE dilution assay (n = 3 per group). Histograms show representative data, and the numbers shown in the histograms indicate the percentage of proliferating CD8+ T cells. Data represent the mean ± SD. *P < 0.05, by 2-factor factorial ANOVA followed by Tukey-Kramer post hoc analysis. The experiments were repeated 2 times with similar results.

