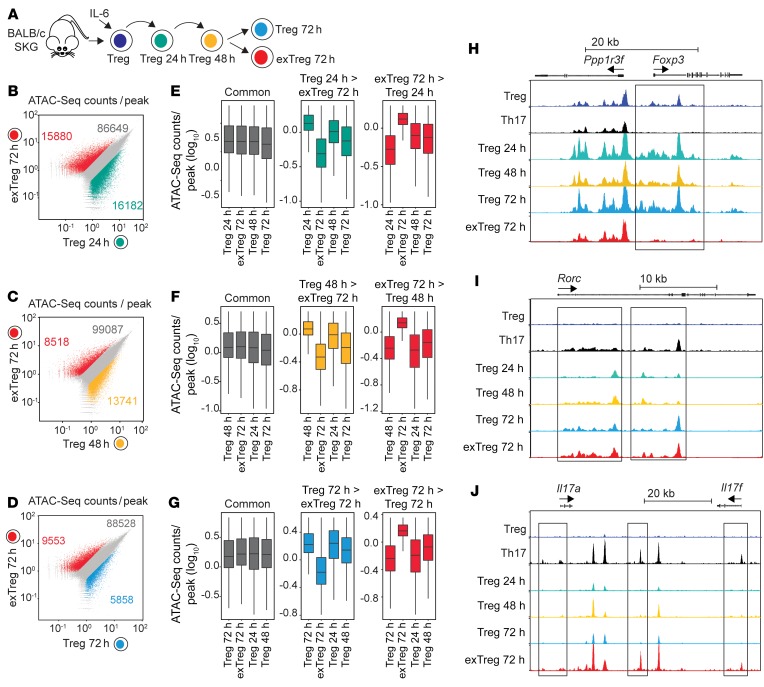
Figure 10. exTregs display a unique chromatin landscape.
(A–J) ATAC-Seq for chromatin accessibility in SKG Tregs and SKG Th17 cells, as well as SKG Tregs during in vitro conversion and SKG exTregs. (A) Experimental design for evaluation of chromatin profile in SKG Tregs during in vitro conversion in the presence of IL-6 (50 ng/ml) and anti-CD3/CD28–coated beads. Tregs were isolated after 24, 48, and 72 hours of culture, whereas exTregs were isolated after 72 hours. (B–D) Scatterplots of ATAC-Seq counts per peak comparing indicated samples. (E–G) Boxplots of ATAC-Seq counts per peak from indicated samples at common or differentially accessible regions from the comparison labeled above. Boxes indicate interquartile range with whiskers ± 1.5 times this range and outlier points. (H–J) Normalized ATAC-Seq coverage at the Foxp3 (H), Rorc (I), and Il17a and Il17f (J) loci in Tregs, Th17 cells, Tregs during in vitro conversion, and exTregs. Scale: 0–1200 for Foxp3 and Rorc, 0–800 for Il17a and Il17f. Black rectangles represent visually evident changes in ATAC signal. ATAC-Seq from 2 independent replicates.

