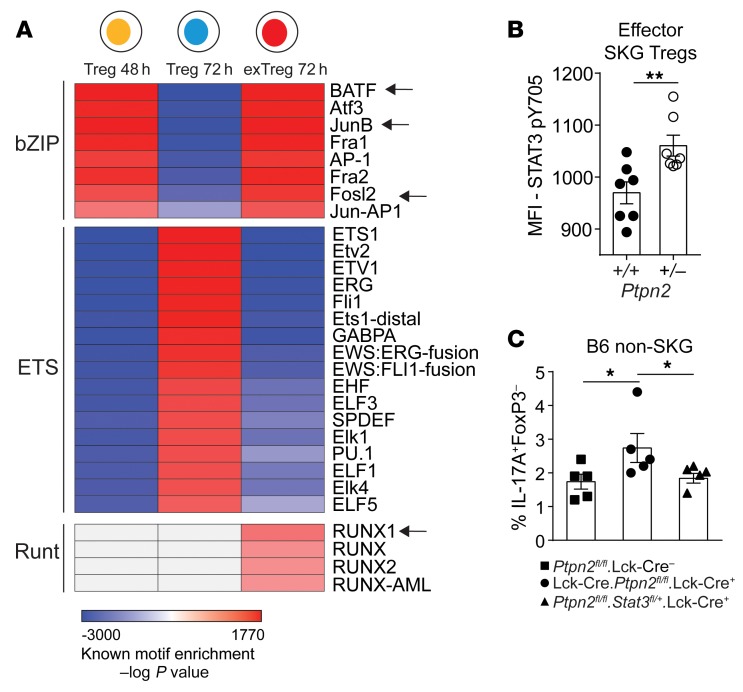
Figure 12. Increased conversion of Ptpn2-haploinsufficient Tregs is mediated through STAT3.
(A) Motif enrichment analysis on differentially accessible regions identified by pairwise comparison of Tregs 24h versus Tregs 48h (“Treg 48 h”), Tregs 48h versus Tregs 72h (“Treg 72 h”), and Tregs 72h versus exTregs 72h (“exTreg 72 h”). Arrows indicate transcription factors that have been reported to associate with STAT3 functions in CD4+ T cells. Motifs with an enrichment log P value less than –35 and found in 10% or more regions and a fold increase of 2.5 over background were used to generate the heatmap. Motif enrichment analysis performed on ATAC-Seq experiment in Figure 10. (B) Activation of STAT3 (pY705) induced by 5 ng/ml IL-6 in Ptpn2+/+ and Ptpn2+/– effector SKG Tregs, analyzed by flow cytometry. (C) In vitro conversion of Ptpn2fl/fl.Lck-Cre– (n = 5), Ptpn2fl/fl.Lck-Cre+ (n = 5), and Ptpn2fl/flStat3fl/+.Lck-Cre+ (n = 5) Tregs isolated from non-SKG B6 mice. Compiled data from 2 experiments are presented (B and C). Each symbol represents an individual mouse in B and C. Two independent replicates are used for ATAC-Seq heatmap. Bars represent mean ± SEM. *P < 0.05, **P < 0.01 by unpaired t test (B) or Mann-Whitney (C).

