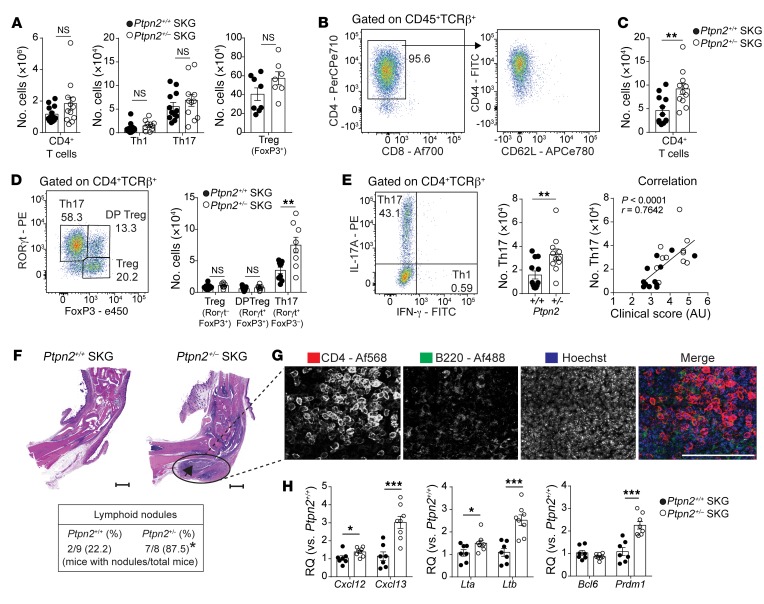
Figure 3. Increased accumulation of synovial Th17 cells and ELSs in Ptpn2-haploinsufficient SKG mice.
(A) Number of CD4+ T cells and effector populations Th1 and Th17 (Ptpn2+/+, n = 12; Ptpn2+/–, n = 11) and Tregs (Ptpn2+/+, n = 8; Ptpn2+/–, n = 7) in popliteal lymph nodes of SKG mice 30–35 days after mannan injection. (B) Distribution of CD4+ and CD8+ T cells among TCRβ+ T cells (left) and expression of CD44 and CD62L on CD4+ T cells (right) in arthritic ankles after mannan injection. (C and D) Number of CD4+ T cells in arthritic ankles and Tregs (TCRβ+CD4+FoxP3+RORγt–), RORγt+ Tregs (TCRβ+CD4+FoxP3+RORγt+), and Th17 cells (TCRβ+CD4+FoxP3–RORγt+) in ankles of Ptpn2+/+ (n = 9) and Ptpn2+/– (n = 8) male SKG mice 30–35 days after mannan injection. (E) Number of Th17 cells (TCRβ+CD4+IL-17A+IFN-γ–; left) and the correlation between clinical score and number of Th17 cells within ankles (right; Spearman correlation) of male Ptpn2+/+ (n = 12, black circles) and Ptpn2+/– (n = 11, white circles) SKG mice 30–35 days after mannan injection. (F) Representative microscopic images used to assess the presence of ELSs (black arrow; scale bars: 500 μm) in male Ptpn2+/+ and Ptpn2+/– SKG mice after mannan injection (*P = 0.015, Fisher’s exact test). (G) Representative 2-dimensional maximum-intensity projection of multipanel confocal images of CD4 (red) and B220 (green) in ELSs from ankle synovial tissue of male Ptpn2+/– SKG mice 35 days after mannan injection. Representative of 3 individual mice. Scale bar: 200 μm. (H) Quantitative PCR analysis of ELS-associated gene expression in ankles of male Ptpn2+/+ (n = 7) and Ptpn2+/– (n = 8) SKG mice 35 days after mannan injection. Compiled data from at least 2 independent experiments are shown in A–H. Each symbol in A–E and H represents an individual mouse. Bars represent mean ± SEM. *P < 0.05, **P < 0.01, ***P < 0.001 by unpaired t test.

