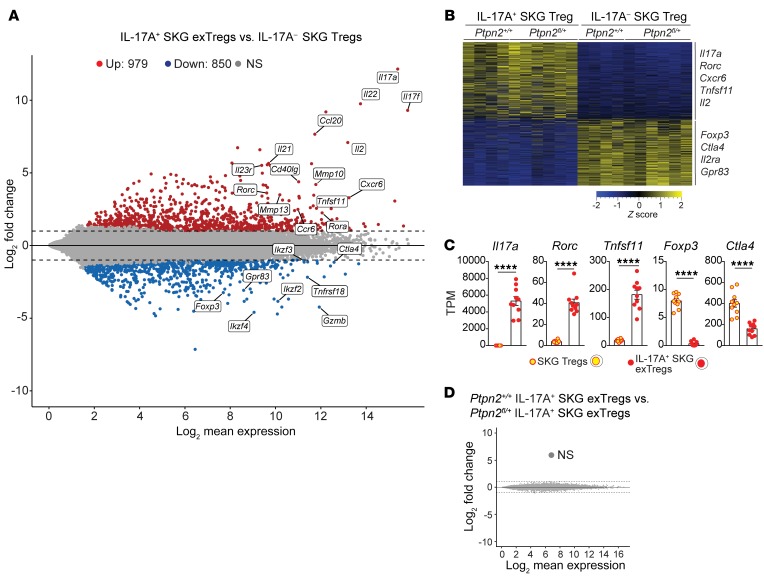
Figure 8. Transcriptomic comparison of in vivo isolated exTregs and Tregs.
(A–D) RNA-Seq performed on IL-17A+ SKG exTregs and IL-17– SKG Tregs sorted from Ptpn2fl/+ (n = 6) or Ptpn2+/+ (n = 4) arthritic fate-mapping mice. (A) Mean-difference plot of significantly (fold change > 2 and adjusted P value < 0.05) upregulated (red) and downregulated (blue) genes in IL-17A+ exTregs versus IL-17A– Tregs. Gray represents nonsignificantly (NS) expressed genes. (B) Heatmap of transcripts per million (TPM) values generated using genes with a fold change greater than 2 and adjusted P value of less than 0.05. (C) Normalized expression of selected genes in SKG IL-17A+ exTregs and IL-17A– SKG Tregs. (D) MD plot comparing Ptpn2+/+ and Ptpn2+/– IL-17A+ exTregs. Compiled data from at least 3 independent experiments are presented. Each symbol in C represents an individual mouse. Bars represent mean ± SEM. ****P < 0.0001 by unpaired t test (C).

