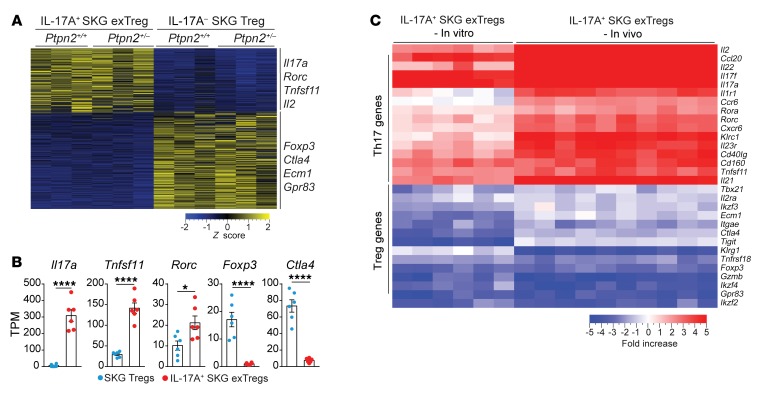
Figure 9. In vitro–generated exTregs recapitulate in vivo exTregs.
(A–C) RNA-Seq analysis performed on IL-17+ SKG exTregs and IL-17– SKG Tregs generated in vitro from Ptpn2+/+ (n = 3) and Ptpn2+/– (n = 3) Tregs isolated from FoxP3eGFP SKG mice and stimulated for 72 hours with IL-6 (50 ng/ml) and anti-CD3/CD28–coated beads. (A) Heatmap of TPM values generated using genes with a fold change greater than 2 and adjusted P value of less than 0.05. (B) Normalized expression of selected genes in IL-17A+ SKG exTregs and IL-17A– SKG Tregs. (C) Expression of 30 genes associated with the transcriptional profile of Tregs and Th17 cells in in vitro IL-17A+ SKG exTregs and in vivo IL-17A+ SKG exTregs. Heatmap represents fold change between Tregs and exTregs generated from raw counts. Compiled data from 3 independent experiments are presented. Each symbol in B represents an individual mouse. Bars represent mean ± SEM. *P < 0.05, ****P < 0.0001 by unpaired t test (B).

