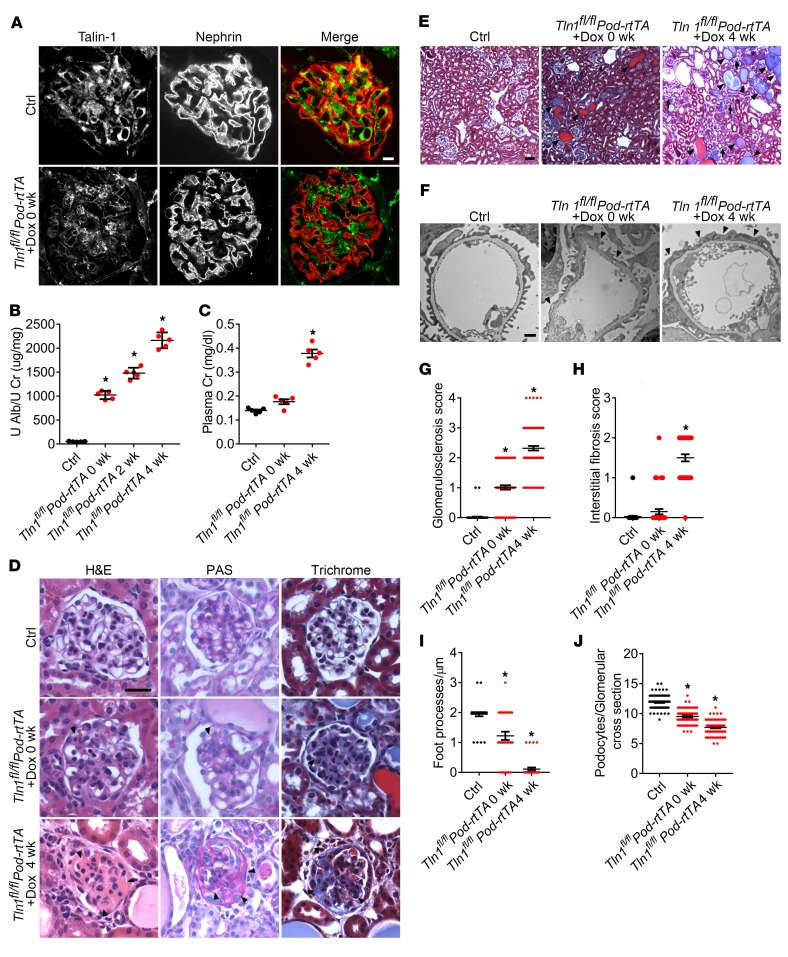
Figure 1. Doxycycline-inducible podocyte-specific Tln1-KO mice have massive proteinuria with kidney failure.
(A) Representative glomerular immunofluorescence images of talin-1 (green) and nephrin (red) in doxycycline-induced (Dox-induced) control and Tln1fl/fl Pod-rtTA TetO-Cre mice. Scale bar: 10 μm. (B) Quantification of urine albumin/creatinine ratio in control and Tln1fl/fl Pod-rtTA TetO-Cre mice at 0, 2, and 4 weeks after completion of Dox induction. *P < 0.05 vs. control; n = 5. (C) Plasma creatinine (Cr) levels in control and Tln1fl/fl Pod-rtTA TetO-Cre mice treated with Dox at 0 and 4 weeks after completion of Dox induction. *P < 0.05 vs. control; n = 5. (D) Representative light microscope images (H&E, periodic acid–Schiff [PAS], and trichrome) of Dox-induced control and Tln1fl/fl Pod-rtTA TetO-Cre mouse glomeruli. Arrowheads show mesangial matrix deposition and mesangial cell proliferation. Scale bar: 25 μm. (E) Representative trichrome staining in control and Tln1fl/fl Pod-rtTA TetO-Cre mouse kidneys at representative time points. Arrowheads depict dilated tubules and proteinaceous casts, and arrows display interstitial fibrosis. Scale bar: 50 μm. (F) Representative transmission electron micrograph (TEM) in control and Tln1fl/fl Pod-rtTA TetO-Cre mouse foot processes after Dox induction. Arrowheads depict podocyte foot process effacement. Scale bar: 1 μm. (G) Quantification of glomerulosclerosis in D. *P < 0.05 vs. control. (H) Quantification of interstitial fibrosis in E. *P < 0.05 vs. control. (I) Quantification of foot processes in F. *P < 0.05 vs. control. (J) Quantification of WT1-positive number per glomerulus in control and Tln1fl/fl Pod-rtTA TetO-Cre mice treated with Dox at 0 and 4 weeks after completion of Dox induction. *P < 0.05 vs. control; n = 3. (B, C, and G–J) Statistically analyzed by 1-way ANOVA with Dunnett’s correction.

