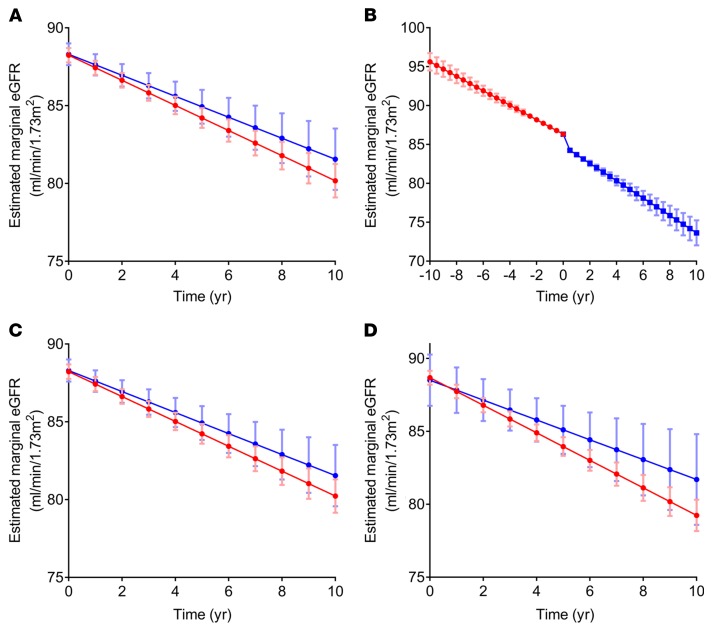
Figure 11. Usage of comparator drugs (lamotrigine, carbamazepine, and levetiracetam) is not associated with declines in eGFR in a Veterans Affairs population cohort.
(A) The slope of eGFR decline among patients treated with comparator drugs compared with controls not treated with comparator drugs. (B) The slope of eGFR decline in patients before and after initiation of comparator drugs. (C and D) The slope of eGFR decline among patients with no or mild proteinuria (1+ or below on urine dipstick) (C) and with heavy proteinuria (>2+ on urine dipstick) (D) with or without comparator drugs. All graphs reflect eGFRs adjusted for age, sex, race, baseline eGFR, HCV, HIV, diabetes, hypertension, congestive heart failure, liver disease, bipolar disorder, depression, post-traumatic stress disorder, prior stroke, epilepsy, and headache. The visualized slopes reflect eGFR at the mode of categorical covariates and the mean of continuous covariates.

