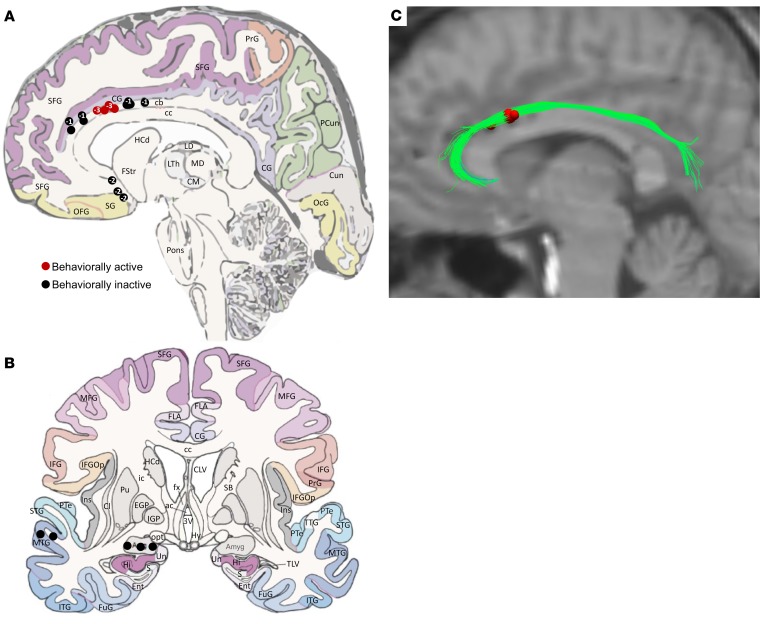
Figure 2. Localization of stimulated electrodes for the 3 patients.
(A and B) Sagittal and coronal views of stimulated locations across the full patient set (n = 3). Numbers inside circular indicators on the sagittal view reflect the number of 1-mm incremental sections from the displayed section in which the contact was located, where “–” corresponds to sections more medial and “+” corresponds to sections more lateral. Red circles indicate behaviorally active contacts, whereas black circles indicate behaviorally inactive contacts. (C) Overlap of the volumes of tissue activated (red) by all behaviorally active contacts across the full patient set (n = 3), relative to the index patient’s diffusion tensor imaging data set, collapsed by side of stimulation. The VTA for all patients robustly engage the cingulum bundle to the exclusion of other fiber systems. cb, cingulum bundle; CG, cingulate gyrus; PrG, precentral gyrus; PCun, precuneus; SFG, superior frontal gyrus; Cun, cuneus; OcG, occipital gyrus; cc, corpus callosum; OFG, orbitofrontal gyrus; SG, straight gyrus; HCd, head of caudate nucleus; FStr, fundus striati; LTh, lateral thalamic nucleus; MD, mediodorsal thalamic nucleus; CM, centromedial thalamic nucleus; LD, lateral dorsal thalamic nucleus; MTG, middle temporal gyrus. The underlying anatomical drawings in A and B were adapted with permission from Elsevier (52).

