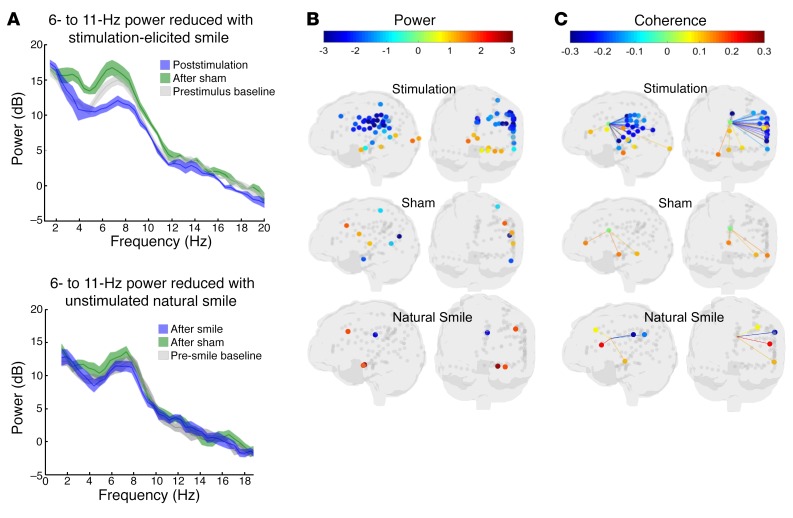
Figure 4. Distinct neural activity patterns associated with stimulation-induced mirth in the index patient.
(A) Top: LFP shows reduced power in decibels (dB) of an endogenous cingulum oscillation of 6 to 11 Hz following stimulation (blue) compared with prestimulus baseline (gray), but not following nonstimulated sham (green). Bottom: Ten natural (unstimulated) social smiles were analyzed during intracranial recording. The endogenous oscillation of 6 to 11 Hz was again observed in the naturalistic data set at the pre-smile baseline (gray) and following sham LFP epochs in which smiling was not present (green) and showed no evidence of reduced power associated with natural smiling (blue). Lighter-colored areas indicate 95% CIs generated by a random reshuffling procedure. (B) LFP shows distinct reduction in power across the recorded lateral-opercular frontal-parietal lobe network (including ipsilateral motor and sensory cortices of the head and face) following stimulation, but not following sham stimulation or unstimulated natural smiles. Ventral ACC, amygdala, parahippocampus, and medial precuneus showed increased in 6- to 11-Hz power (increased synchrony) following cingulum stimulation. (C) After stimulation, LFP likewise showed reduced network coherence between the cingulum and multiple contacts corresponding to the ipsilateral motor/sensory cortices of the head/face, but not following sham stimulation or unstimulated natural smiles. For B and C, the colored dots indicate electrode locations and the corresponding power, using the heatmap as indicated in the legend. Only contacts with statistically significant changes in power or coherence are presented with colored dots; gray dots indicate contact locations with nonsignificant changes in power or coherence. Statistical significance reflects the percentile of the null (random) distribution at which the actual value was observed. For more precise colocalization of significant contacts within the anatomic MRI, see Supplemental Figures 2 and 3.

