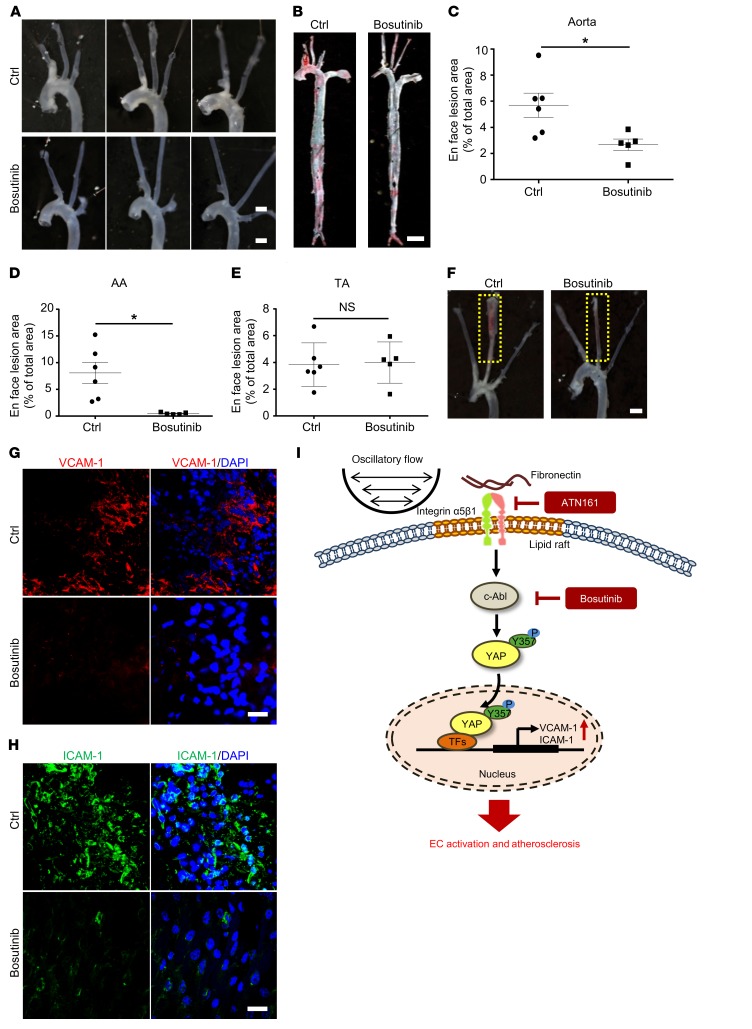
Figure 7. Bosutinib retarded both diet-induced and partial ligation–induced atherosclerosis in Apoe–/– mice.
(A–E) Bosutinib (30 mg/kg) was injected every 3 days for 5 weeks into Apoe–/– mice, which were fed a WTD from the second week. (A and B) Representative gross and Oil Red O staining of aortas. Scale bar: 1.5 mm (A); Scale bar: 4 mm (B). (C–E) Quantification of lesion area in panel B. AA, aortic arch; TA, thoracic aorta; NS, not significant. Data are mean ± SEM, *P < 0.05 (Student’s t test), n = 5–6. (F–H) Partial ligation was performed on left common carotid artery of Apoe–/– mice with or without bosutinib. Representative images are shown in panel F, n = 6. Scale bar: 2 mm (F). (G and H) En face immunofluorescence staining of the expression of VCAM-1 and ICAM-1 in ECs of mice with carotid artery ligation, n = 6. Scale bar, 20 μm. (I) A proposed model of c-Abl/YAP regulated by oscillatory flow in EC activation and atherosclerosis.

