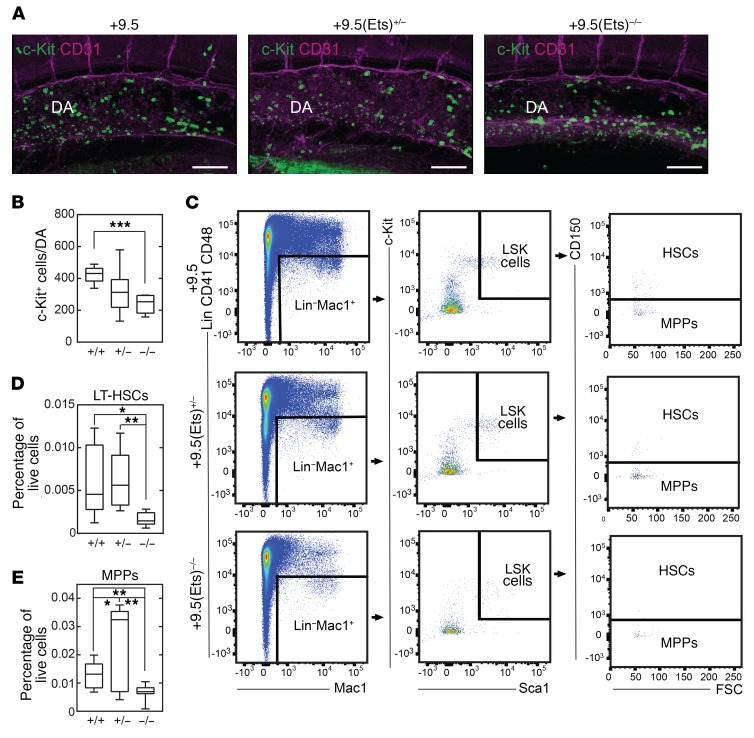
Figure 5. The +9.5 enhancer Ets motif is dispensable for HSC emergence.
(A) Whole-mount immunostaining of E10.5 dorsal aorta. CD31+ cells are shown in magenta and c-Kit+ cells in green. Scale bars: 100 μm. (B) c-Kit+ cell quantification within the dorsal aorta from +9.5+/+ (n = 6), +9.5(Ets)+/– (n = 8), and +9.5(Ets)–/– (n = 6) mice. Data are from 4 experiments. (C) Flow cytometric analysis of E15.5 fetal liver HSCs (Lin−CD41−CD48−Mac1+Sca1+Kit+CD150+) and MPPs (Lin−CD41−CD48−Mac1+Sca1+Kit+CD150–). (D and E) Quantification of HSCs and MPPs (percentage of live fetal liver cells) from +9.5(Ets)+/+ (n = 9), +9.5(Ets)+/– (n = 11), and +9.5(Ets)–/– (n = 8) mice. Data are from 2 experiments. Quantitative data are represented as box-and-whisker plots, with bounds from the 25th to 75th percentiles, the median line, and whiskers ranging from minimum to maximum values; *P < 0.05, **P < 0.01, and ***P < 0.001, by 2-tailed, unpaired Student’s t test with Benjamini-Hochberg correction.

