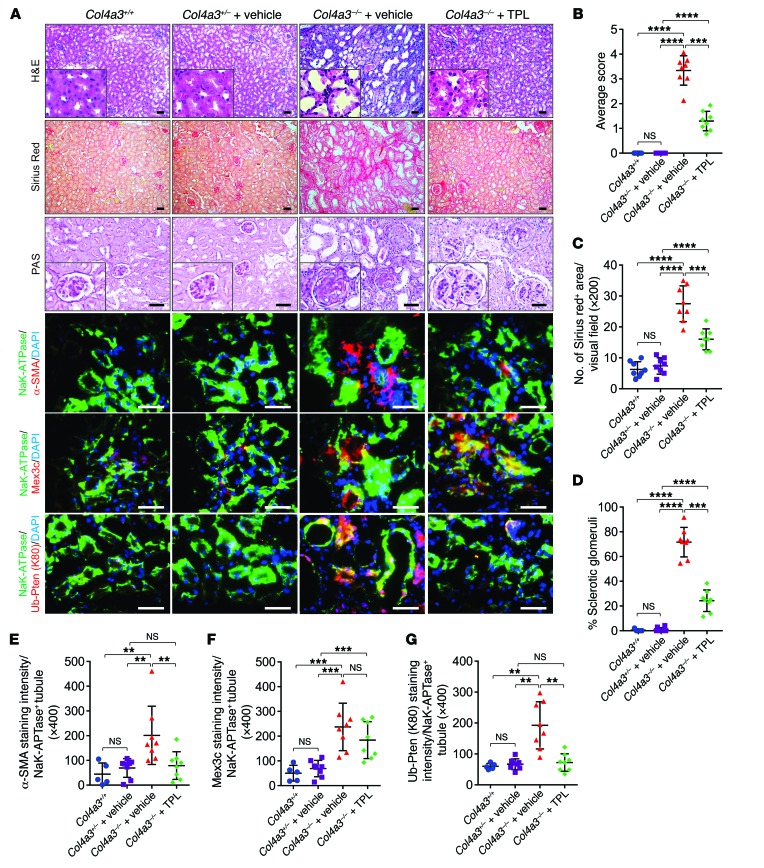
Figure 7. Triptolide alleviates kidney fibrosis.
(A) Representative images of H&E staining, Sirius red staining, PAS staining, immunofluorescence staining of α-SMA, MEX3C, and Ub-PTEN (K80) per Na+K+-ATPase+ tubule. Scale bars: 100 μm. (B–G) Statistical analysis of tubular injury score (B), percentage of Sirius red staining area (C), percentage of sclerotic glomeruli (D), staining intensity of α-SMA (E), MEX3C (F) and Ub-PTEN (K80) (G) per Na+K+-ATPase+ tubules of Col4a3+/+, Col4a3+/– + vehicle, Col4a3–/– + vehicle, and Col4a3–/– + TPL kidneys. Error bars indicate SD; n = 5, 8, 8, and 8 animals; 6 independent fields per animal were calculated (1-way ANOVA). NS indicates P > 0.05, **P < 0.01, ***P < 0.001, and ****P < 0.0001.

