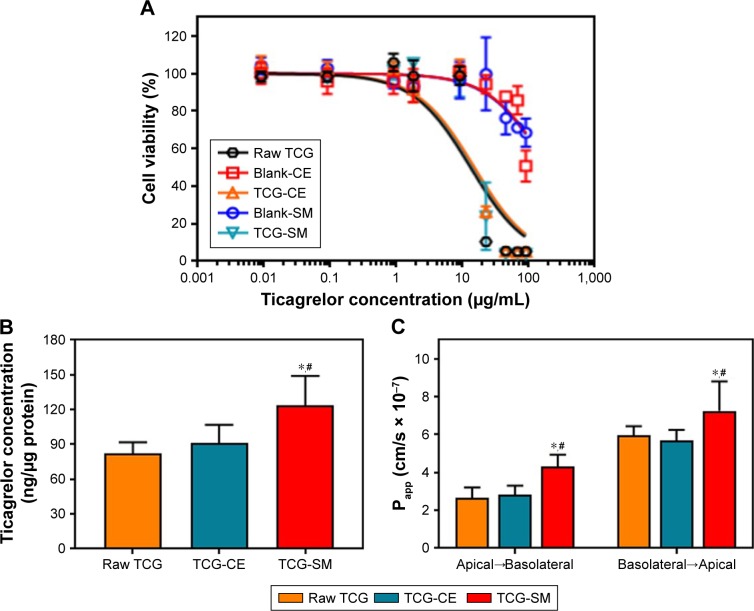
Figure 6.
(A) Cell viability of Caco-2 as a function of TCG corresponding concentration for raw TCG solution, blank-CE, TCG-CE, blank-SM, and TCG-SM. (B) Caco-2 cellular uptake of TCG treated with raw TCG solution, TCG-CE, and TCG-SM after incubation for 4 hours. (C) Papp of raw TCG solution, TCG-CE, and TCG-SM across Caco-2 cell monolayer.
Notes: (A) Values are expressed as mean ± SD (n=4). (B) Values are expressed as mean ± SD (n=4). *P<0.05 vs raw TCG solution, #P<0.05 vs TCG-CE. (C) Values are expressed as mean ± SD (n=4). *P<0.05 vs raw TCG solution, #P<0.05 vs TCG-CE.
Abbreviations: blank-CE, Cremophor EL without ticagrelor; blank-SM, self-microemulsifying drug delivery system without ticagrelor; CE, Cremophor EL; Papp, apparent permeability coefficients; SM, self-microemulsifying drug delivery system; TCG-CE, ticagrelor-loaded Cremophor EL; TCG-SM, ticagrelor-loaded self-microemulsifying drug delivery system; TCG, ticagrelor.

