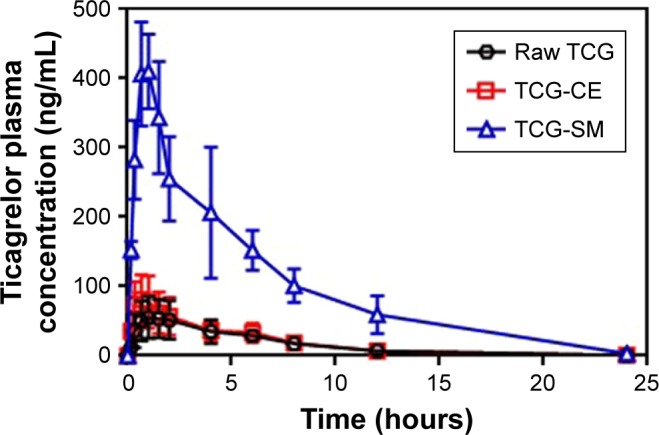
Figure 7.

Mean plasma concentration–time profiles of TCG in rats after oral administration of raw TCG suspension, TCG-CE, and TCG-SM at a dose equivalent to 10 mg/kg of TCG.
Note: Values are expressed as mean ± SD (n=11).
Abbreviations: TCG, ticagrelor; TCG-CE, ticagrelor-loaded Cremophor EL; TCG-SM, ticagrelor-loaded self-microemulsifying drug delivery system.
