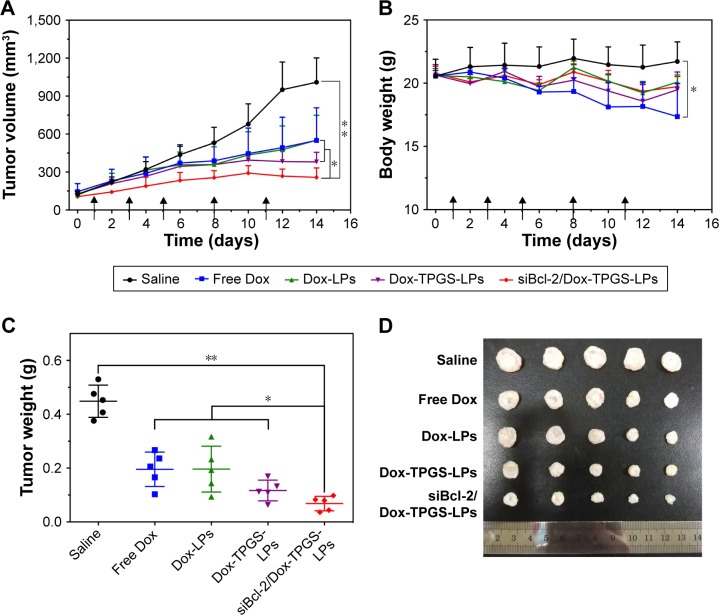
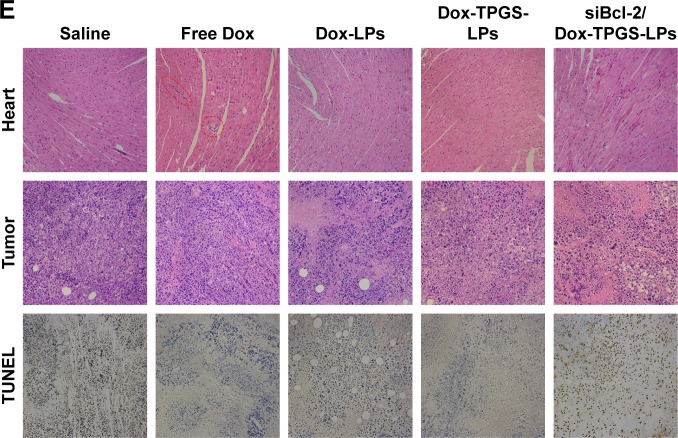
Figure 8.
In vivo antitumor efficacy of the different formulations in H22 tumor-bearing BALB/c female mice.
Notes: (A) Tumor volume and (B) body weight changes during the treatment period. The black arrows on the x-axis represent the time points of intravenous injections (ie, Days 1, 3, 5, 8, and 11). The injected dose of Dox and siBcl-2 per administration was 5 mg/kg and 1.2 mg/kg, respectively (n=5). (C) The weight and (D) image of tumors separated from the mice at the end of the experiment. (E) H&E staining of the heart and tumor tissues, and immunofluorescence analysis of the tumor tissues. The red dotted circles represent damaged cardiomyocytes after free Dox treatment. Data are presented as mean ± SD (n=5). *P<0.05 and **P<0.01.
Abbreviations: Dox, doxorubicin; LPs, liposomes; siBcl-2, Bcl-2 siRNA; TPGS, D-α-tocopherol polyethylene glycol 1000 succinate.


