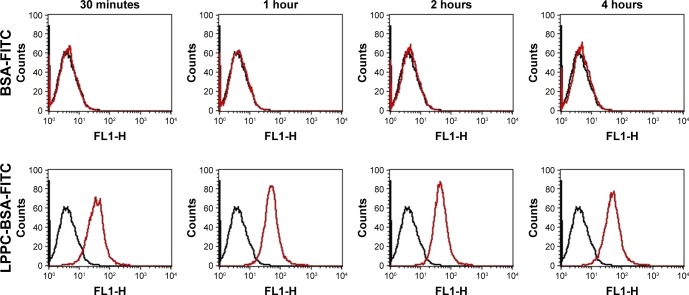
Figure 4.
Fluorescence of intracellular LPPC/BSA-FITC complexes in HepG2 cells.
Notes: HepG2 cells were treated with LPPC/BSA-FITC complexes (10:40 µg) or 40 µg of BSA-FITC at 37°C for different amounts of time. The fluorescence of cells was analyzed by flow cytometry. Black lines indicate untreated cells and red lines indicate cells treated with LPPC/BSA-FITC. Representative flow cytometry plots of three independent experiments are shown.
Abbreviations: FITC, fluorescein isothiocyanate; LPPC, liposomes containing polyethylenimine and polyethylene glycol complex.

