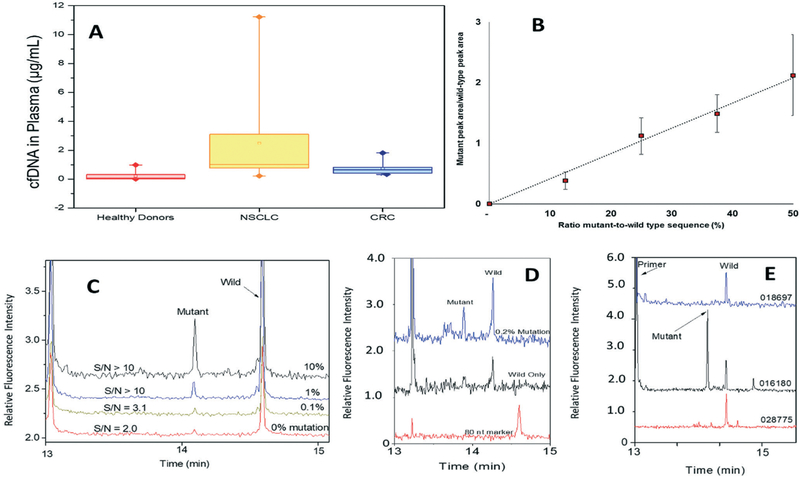
Fig. 5.
(A) cfDNA level detected in the plasma of healthy donors and patients diagnosed with CRC and NSCLC. DNA quantification was done using the 18S housekeeping gene as the reference according to the procedure described in the Experimental section and ESI.† Samples from 6 healthy donors, 3 NSCLC and 5 CRC patients were processed (≥3 replica each). (B) Peak area ratio for detected mutant and wild-type ctDNA/cfDNA targets as observed by capillary gel electrophoresis. (C) Electropherograms for detection of the G12V mutation present at different frequencies in the plasma sample. (D) Separation of LDR products for samples containing different levels of G12D mutant ctDNA model. (E) Electropherograms of LDR products following G12S KRAS mutation analysis of clinical samples (see sample IDs in the figure and in Table S2†).

