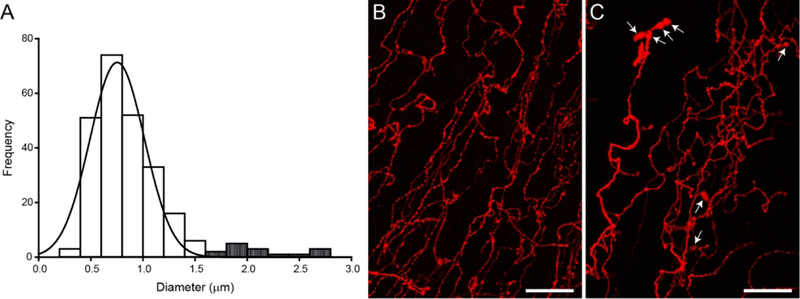
Figure 6.

Corneal nerve varicosities are enlarged after acute noxious chemical stimulation. (A) A histogram displaying the frequency of cross-sectional diameters measured from 250 varicosities (25 varicosities/scan, 2 scans/cornea, 1 cornea/animal; n = 5 animals) and fitted with a peak Gaussian curve. White bars represent the varicosity diameters measured from a Control cornea and the majority of varicosities from stimulated corneas. Striped bars represent those large varicosities only found in stimulated corneas. (B) High magnification image of p-tubulin-labeled corneal nerves from a Naïve animal demonstrates thin nerves beaded with varicosities. (C) Hypertonic saline stimulation leads to distended varicosities (arrows). Images are projections of optical slices taken through the corneal epithelium. Scale bars = 20 μm
