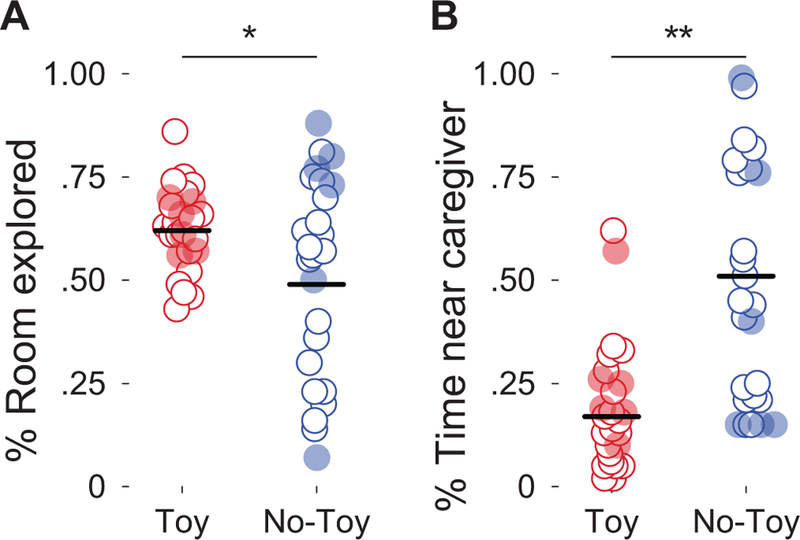
Figure 5.

Infants in the toy condition (A) explored a greater percent of the room and (B) spent a lower percent of the session within 100 cm of the caregiver. Open circles plot infants in toy and no-toy conditions. Filled circles show infants in the follow up conditions (toys-piled in red and mom-moved in blue) and are not included in the group means (horizontal black bars). Asterisks denote statistical significance.
