
Figure 6.
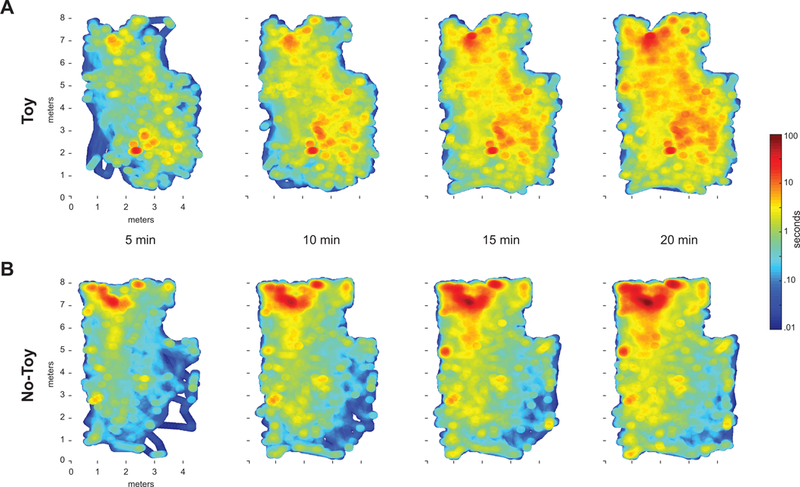
Heat maps showing the average number of seconds spent in each location in the playroom (estimated as a 15-cm radius circle centered on the left foot) at 5, 10, 15 and 20 minutes into the session. Infants in the toy-filled room (A) covered more area and continued to visit new locations over time. (B) Infants in the no-toy room spent more time near their caregivers (the dark red patches at the top of each map) and visited new room locations at a slower rate. Note that time in each location is displayed on a logarithmic scale with the highest value 10000 times the lowest value.