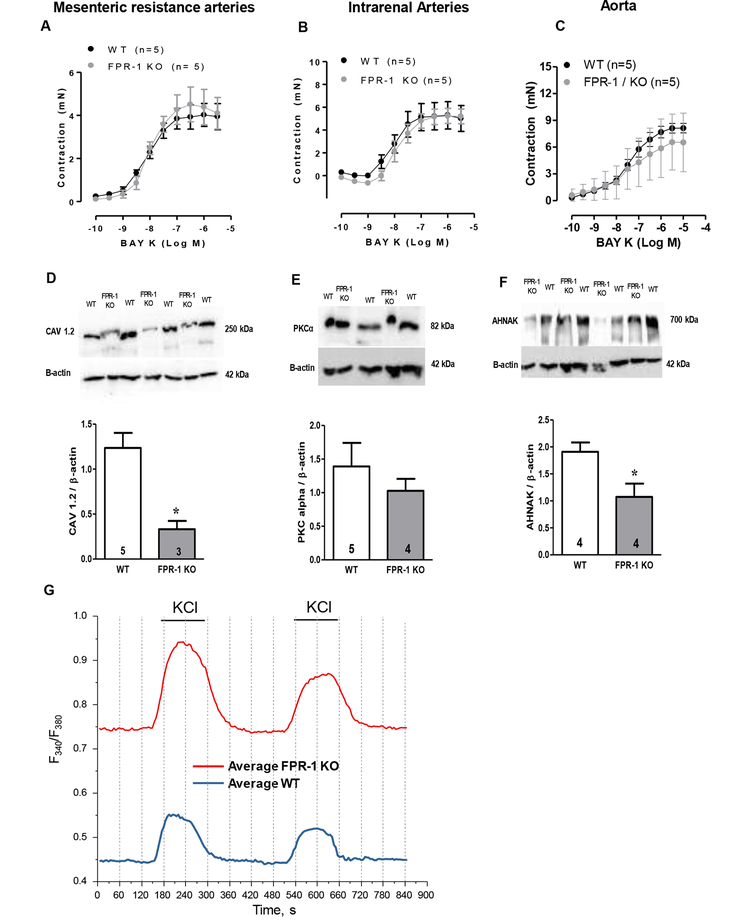
Figure 8.
Concentration-response curve to Bay K8644 (Bay K), L-type calcium channel (Cav 1.2) activator, in arteries from WT and FPR-1 KO mice (A, B and C). Representative blots (top) and densitometric analyses (bottom) from WT or FPR-1 KO in VSMCs for Cav 1.2 (D), PKCα (E), AHNAK (F) and β-actin. Number (n) of the animals used is indicated in the graphs. Student’s t-test: *p<0.05 vs. WT. Single-cell intracellular Ca2+ measurements on fura-2-loaded VSMC showed that baseline intracellular Ca2+ concentration (absence of stimulus) is higher in VSMC from FPR-1-KO when compared to WT (G and table 1). KCl (120 mM) was used to induce Ca2+ influx (G and table 1).

