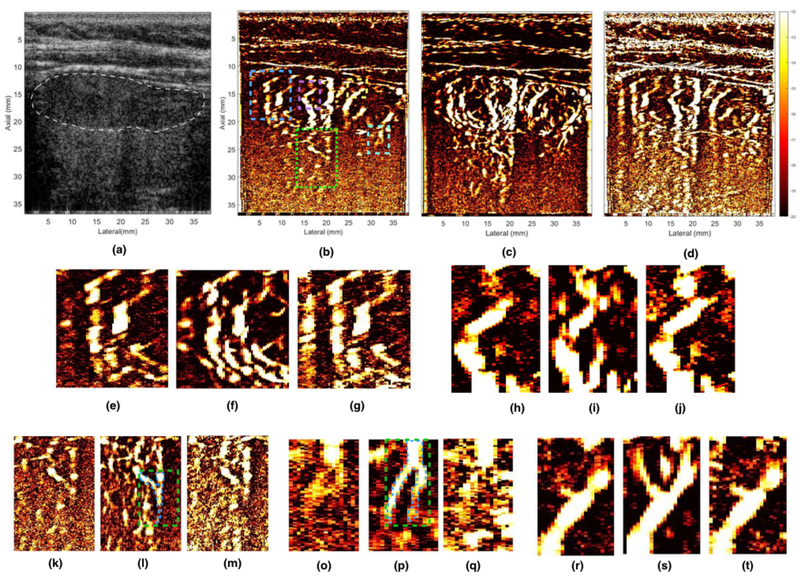
Figure 2.

displays the representative in vivo B-mode and PD image of the thyroid nodule, obtained using SVD based clutter filtering. (a) displays the PW sonogram, (b, c) displays the PD image, pre- and post-motion correction, respectively, thresholded at the same SV threshold (420). (d) displays PD image corresponding to (b), but at a lower SV threshold (220), to allow increased contribution from blood signal, which may have been suppressed with clutter in (b). Figures (e, h, k, o, r) show zoomed insets obtained from (b). Figures (f, i, l, p, s) show zoomed insets obtained from (c). Figures (g, j, m, q, t) show zoomed insets obtained from (d). The ROI for the five zoomed insets have been outlined in the (b), where blue, magenta, yellow, green and cyan regions corresponds to (e-g), (h-j), (k-m), (o-q), and (r-t), respectively. The location of the nodule has been indicated in white in the sonogram (a). The CNR metric was calculated from the vessels indicated in green ROIs (l, p).
