
Figure 4.
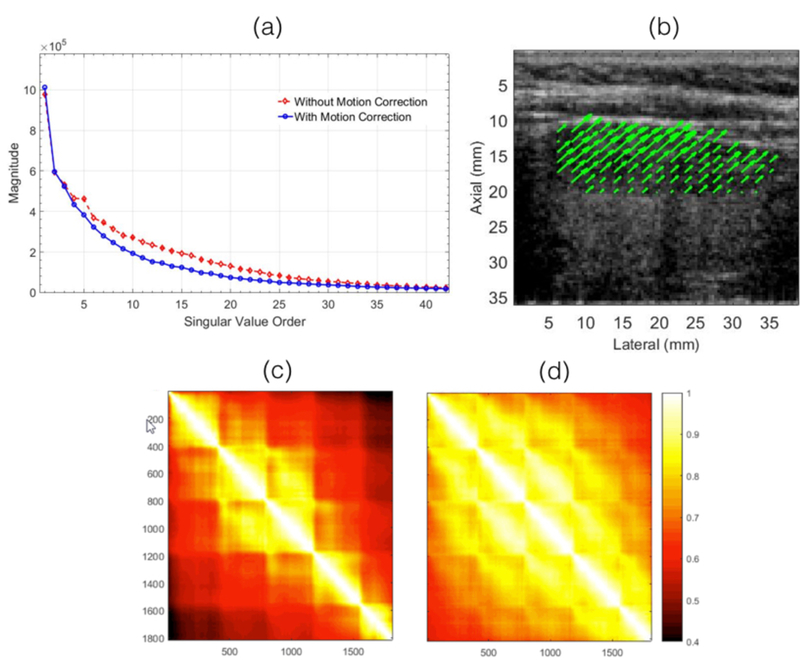
displays the the singular value order and covariance of the spatiotemporal Casaroti matrix associated with the in vivo thyroid images. (a) displays the singular value decay associated with pre- and post-motion corrected data. The covariance of the pre- and post-motion corrected spatiotemporal matrix is displayed in (c) and (d), respectively. (b) displays the 2D motion vectors associated with the thyroid nodule.