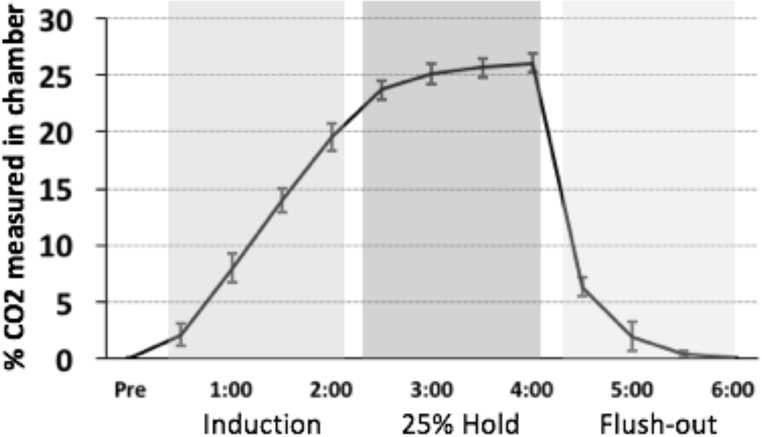
Figure 2.
Measurements of CO2 concentration in chamber during “induction”, “Hold”, and “Flush-out” phases. Mean (+/− SEM) percent CO2 concentrations in the CO2 chamber during the induction, 25% hold, and flush-out periods, as measured by a device located directly inside the chamber. Note that after 2 min and 30 seconds of CO2 infusion, the levels inside the chamber reach the desired concentration of 25%.

