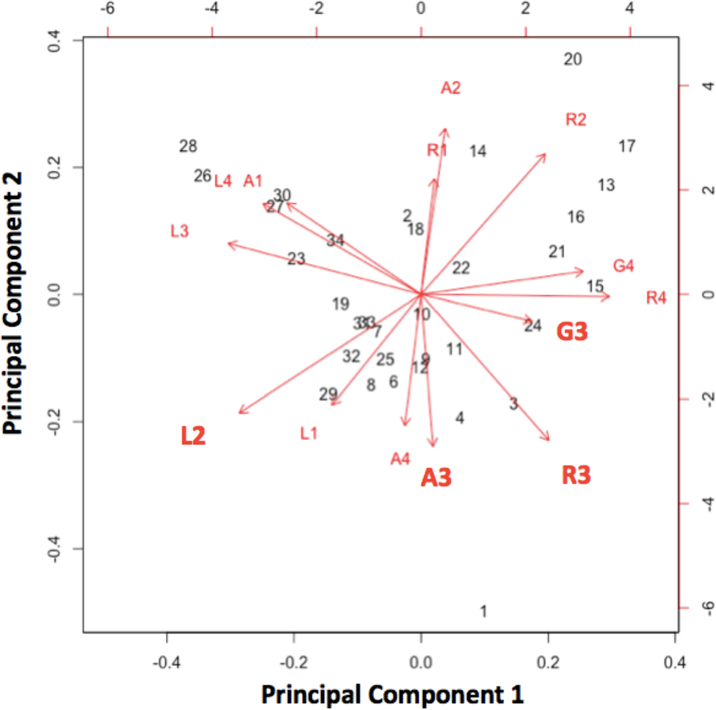
Figure 7. Principal component analysis vectors for A3, R3, G3, and L2.
Our results revealed that the first 2 principal components accounted for ~ 50% of the overall variance, and the first four principal components accounted for nearly 80% of the variance. Here, we show the relationship between the vectors for all the predictor variables, which conveys that A3 was predominantly associated with principal component 2, G3 was predominantly associated with principle component 1, and R3 and L2 were associated with a combination of the two.

