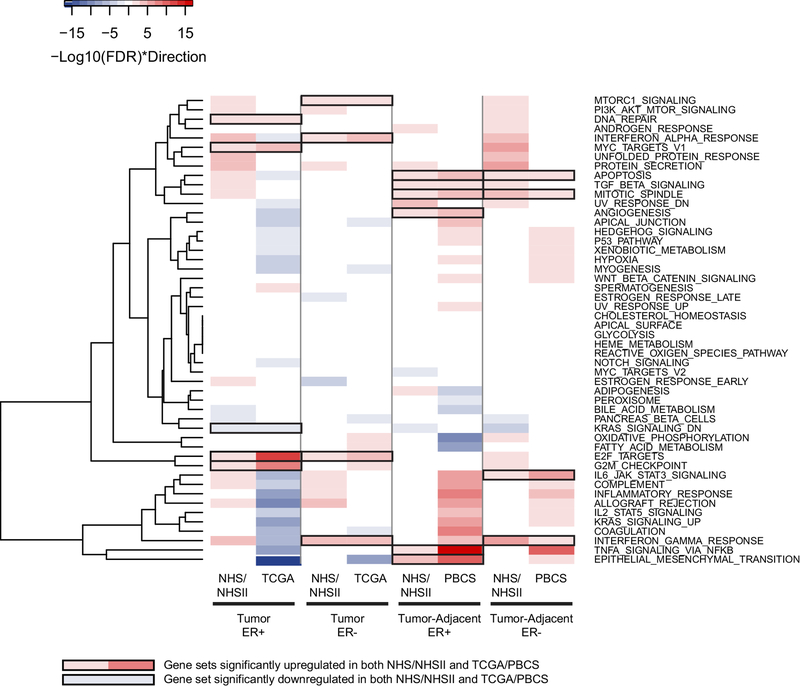
Figure 2.
Heatmap displaying the enrichment of 50 Hallmark gene sets (FDR<0.05) with every 5 kg/m2 increase in BMI in estrogen receptor positive (ER+) or negative (ER-) post-menopausal women from the Nurses’ Health Study (NHS) and the validation cohorts (The Cancer Genome Atlas (TCGA) for tumors and Polish Breast Cancer Study (PBCS) for tumor-adjacent). Upregulated gene sets are in red; downregulated gene sets are in blue; validated gene sets are highlighted using black outlines.

