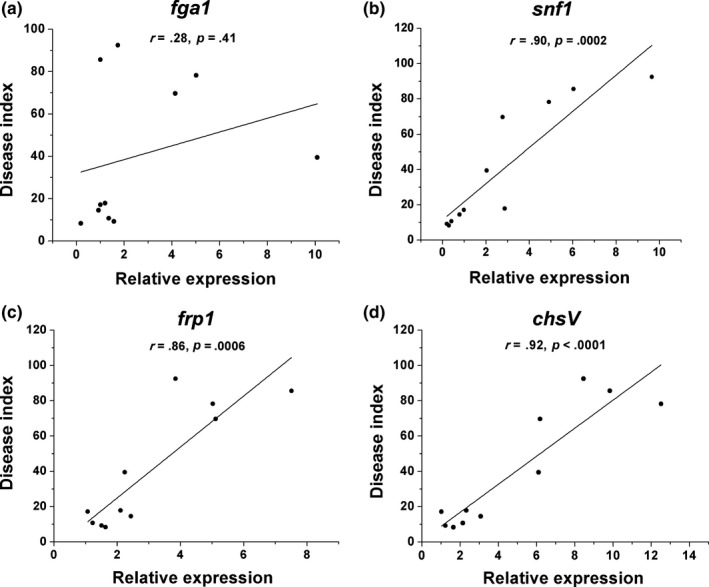
Figure 3.

Correlation analysis between disease index of cucumber Fusarium wilt and gene expression levels in Foc strains serially passaged through resistant and susceptible cultivars, respectively. (a) G‐protein α subunit encoding gene fga1. (b) Sucrose nonfermenting 1 gene snf1. (c) F‐box protein encoding gene frp1. (d) Class V chitin synthase gene chsV. The Pearson's correlation coefficients (r) are calculated basing on the three replicates of foc‐3b and 10 offspring strains isolated from each generation and cultivar
