Figure 7.

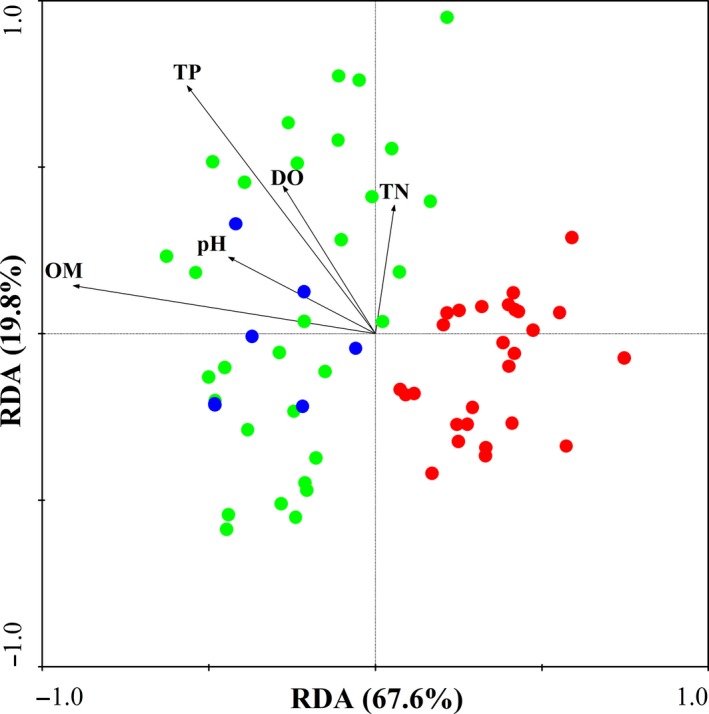
RDA of the bacterial communities as affected by environmental conditions and based on the relative abundance of dominant bacterial phyla (red represents the lake, green represents the lake wetland, and blue represents the estuary)

RDA of the bacterial communities as affected by environmental conditions and based on the relative abundance of dominant bacterial phyla (red represents the lake, green represents the lake wetland, and blue represents the estuary)