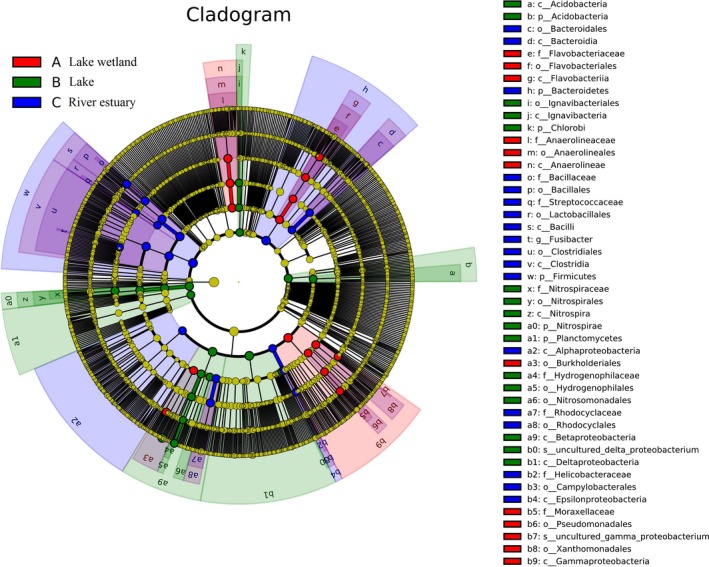
Figure 8.

Cladogram showing the phylogenetic distribution of microbial communities associated with the sediments from the three regions; lineages with LDA values of 3.0 or higher as determined by LEfSe are shown. Differences are represented by the color of the most abundant class. Red (a) indicates lake wetland region, green (b) lake region, and blue (c) river estuary region; yellow represents insignificant difference. The diameter of each circle is proportional to a taxon's abundance. Circles from inner region to outer region represent the phylogenetic levels from domain to genus
