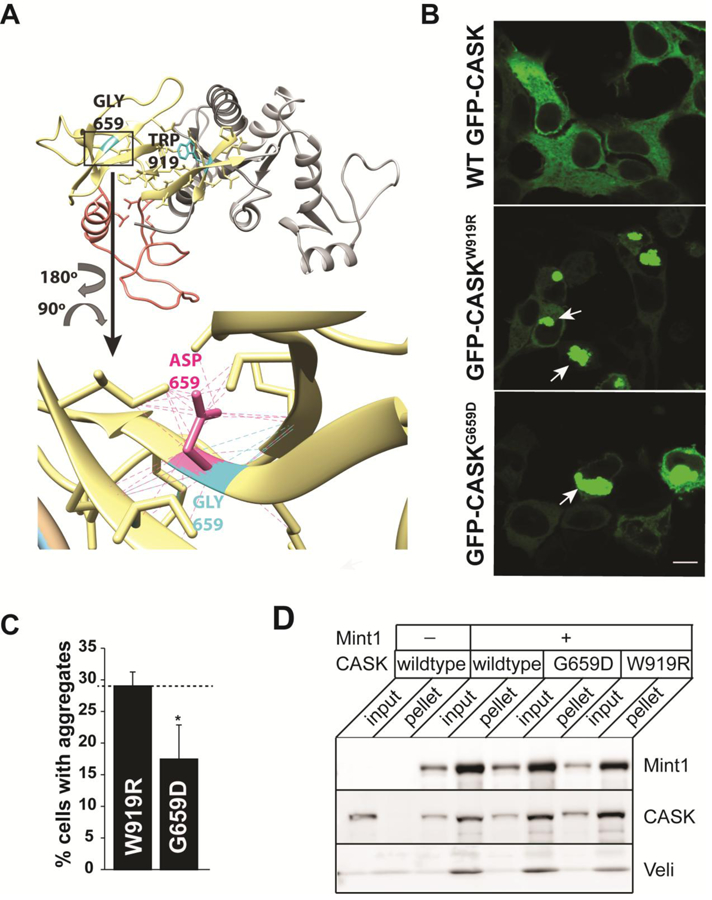
Figure 3. Structural impacts of the G659D mutation.

A) Homology model of CASK’s integrated SH3-GUK domain structure (LaConte et al. 2014) showing the location of native residues G659 and W919 (cyan), as well as mutant side chains (G659D, magenta) and associated contacts (dotted lines). SH3 region, yellow. Hinge region, orange. GUK region, gray. B) Representative images of HEK293FT cells expressing GFP-CASK plasmid as indicated. Note aggregation of protein (indicated by arrows) for both GFP-CASKW919R and GFP-CASKG659D. Scale bar = 10μm. C) Quantitation of percentage of cells displaying protein aggregates. The data is represented as mean ± S.E.M., n = 8. * indicates p < 0.05. D) Representative blot showing immunoprecipitation of FLAG-tagged Mint1. HEK293FT cells were transiently transfected with cDNA for GFP-CASK (wild-type and mutants) and FLAG-Mint1 as indicated. FLAG-Mint1 was precipitated from solubilized cells using the M2 beads and blotted for indicated antigens.
