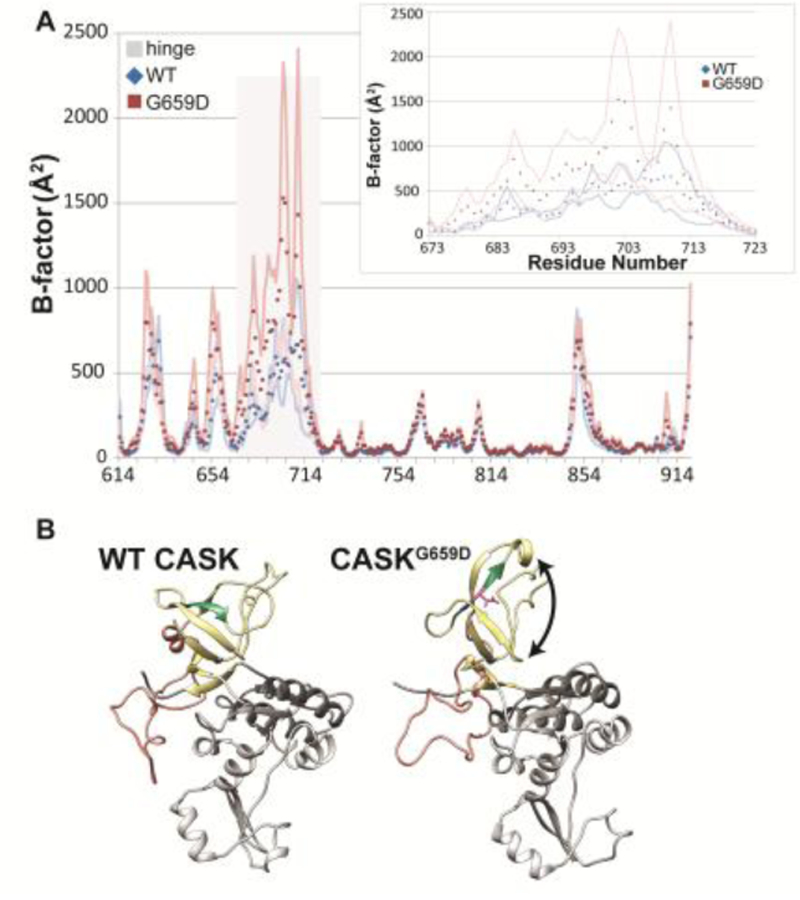
Figure 5. Molecular dynamics simulations predict increased mobility of CASK’s hinge region and disruption of the SH3 domain.

A) B-factors (Å2) calculated from RMS fluctuations of α-carbons in a homology model of CASK’s SH3-GuK (CASK-WT, blue; CASKG659D, red) domain during 100 ns of molecular dynamics simulations at each residue. Points are the average B-factor at a given position, and lines are upper and lower SEM boundaries (n = 3 trajectories). The residues that compose the hinge region are indicated by gray bar. Inset, hinge region. B) Most populated CASKWT (left) and CASKG659D (right) structures during three 100 ns molecular dynamics trajectories based on cluster analysis. SH3 domain, yellow. Hinge region, orange. GUK domain, gray. β strand containing site of G659D mutation, green. Black arrow indicates disrupted β-barrel structure.
