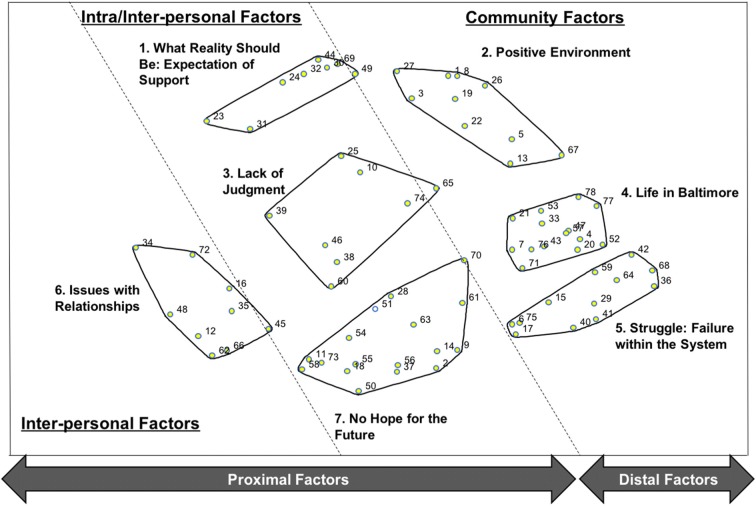
Fig. 2.
Final cluster map (n = 7) showing community influences on male partner violence perpetration in relation to the socio-ecological model. The 78 statements that were generated, sorted, and rated by the participants comprise the clusters and are indicated by numbered points on the map. See Table 2 for the list of statements and corresponding point numbers. Cluster labels were created using suggestions from participants

