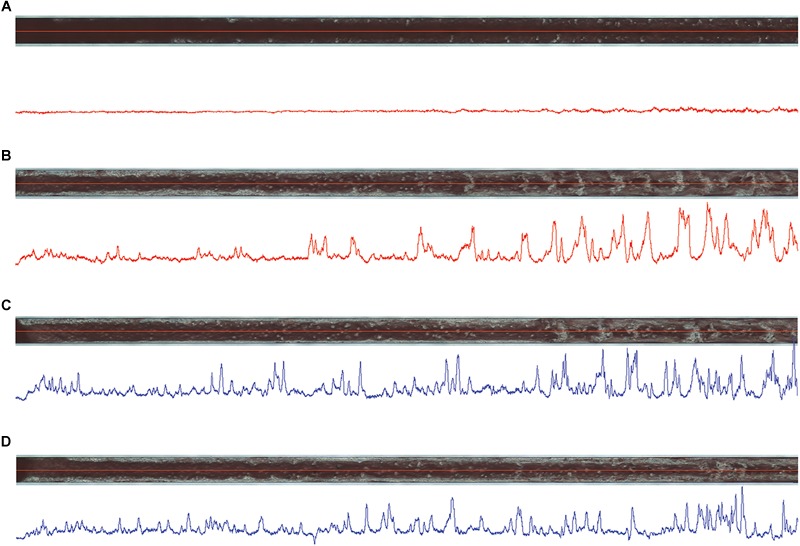
FIGURE 7.

Images of thrombi formed inside capillaries of atheroma chips (AR) under flow conditions in HD1- (A) and HD22-treated (C) (both at 15 μM) blood samples obtained from one volunteer in comparison to controls (B,D), respectively, at 12 min of measurements. Blue and red lines below the images correspond to thrombi profile in the middle of capillaries, where high peaks correspond to high density of thrombi inside capillaries.
