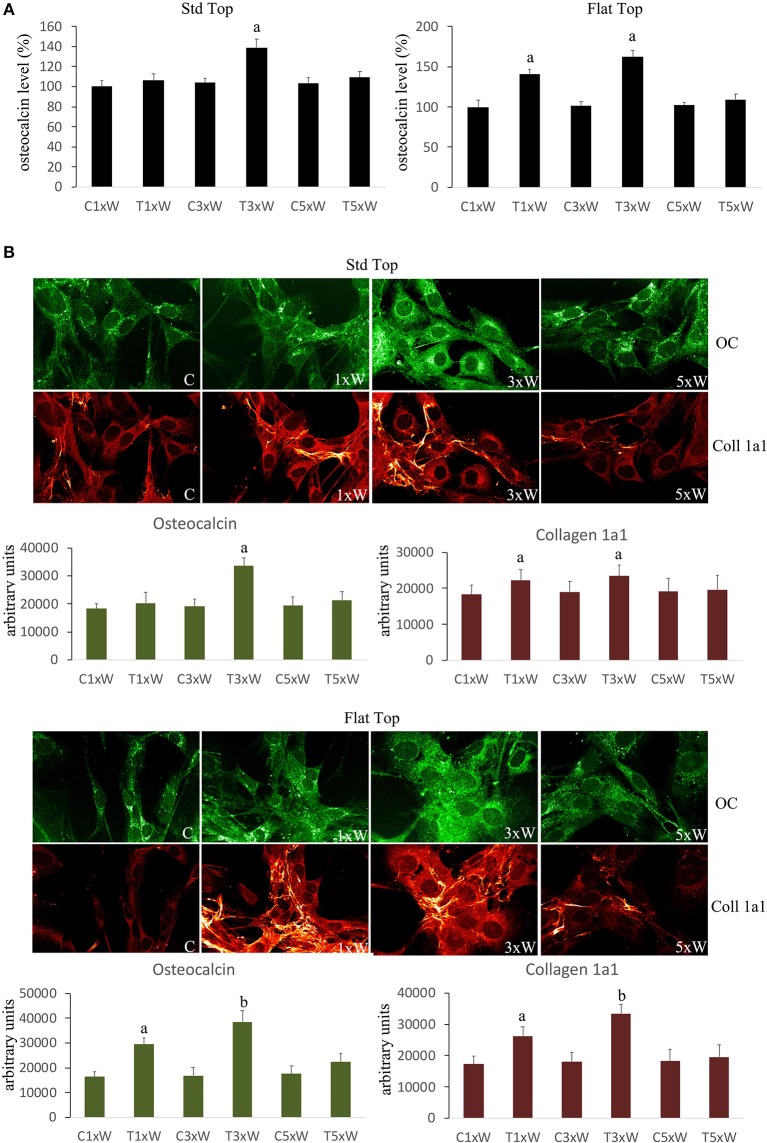
Figure 5.
(A) Osteocalcin detection in the culture medium (n = 3). (B) Double immunolabeling for osteocalcin and collagen type 1 (coll 1a1) and the image analysis (n = 3). The Fluorescence analysis was quantified by a Tecan Infinite fluorescence reader and values were analyzed by Magellan v4.0 software. Bars with different letters show the statistically significant differences among the samples analyzed. Values represent means ± S.E; p < 0.05, two-way ANOVA followed by Tukey test.

