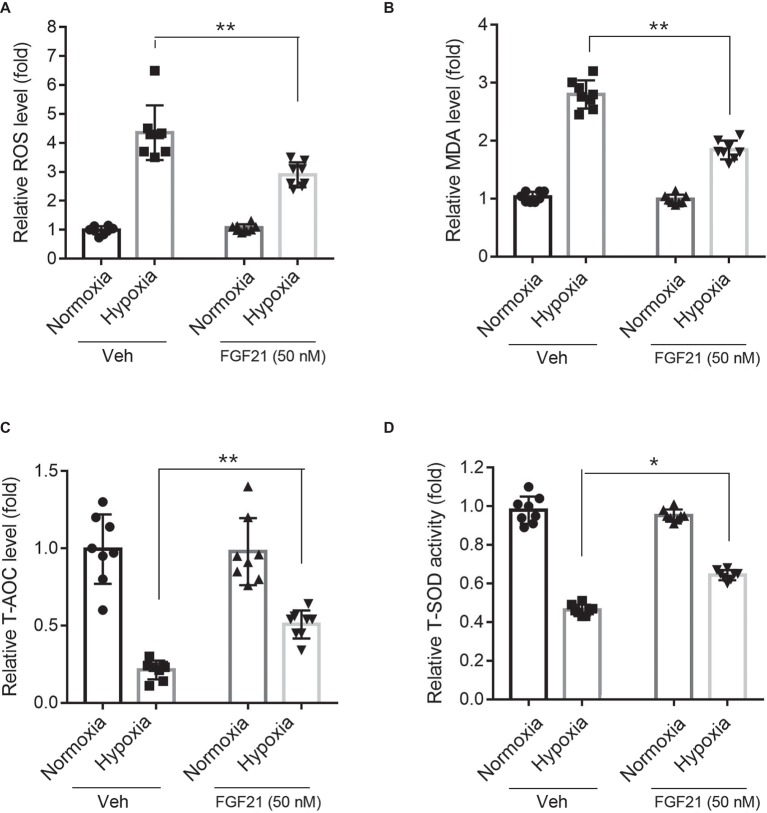
Figure 3.
FGF21 suppresses hypoxia-induced oxidative stress in CMECs. (A) Quantitative analysis of intracellular ROS production in CMECs. **p < 0.01 vs. Veh. N = 8. (B) Quantitative analysis of intracellular MDA level in CMECs. **p < 0.01 vs. Veh. N = 8. (C) Quantitative analysis of intracellular total anti-oxidant activity (T-AOC) in CMECs. **p < 0.01 vs. Veh. N = 8. (D) Quantitative analysis of intracellular total SOD activity (T-SOD) in CMECs. *p < 0.05 vs. Veh. N = 8. Veh, vehicle. For N = 8, experiments were conducted in eight different wells of cultured cells.

