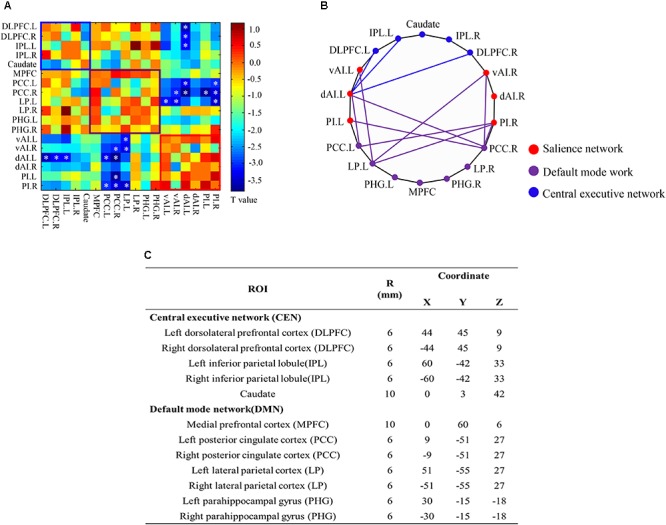
FIGURE 5.

ROI-wise interregional connectivity analysis among salience network, central executive network and default mode network across all participants (p < 0.05, false discovery rate corrected). (A) Colored matrix indicating t-values of interactions among salience network, central executive network and default mode network. (B) Significant difference in interregional functional connectivity between SNHL and Controls. (C) Detailed ROI coordinates extracted from central executive network and default mode network. SNHL, sensorineural hearing loss. ∗p < 0.05.
