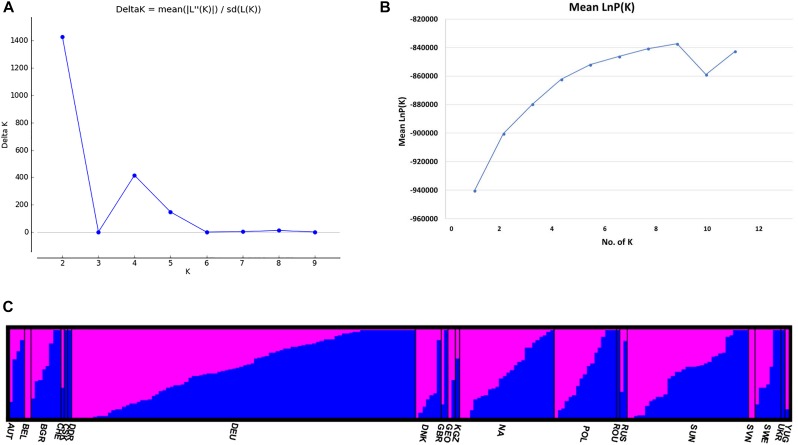
FIGURE 4.
(A) Delta K (ΔK) for different numbers of subpopulations (K); (B) the average log-likelihood of K-value against the number of K; (C) estimated population structure of 213 Camelina sativa accessions on K = 2 according to geographical locations. Accessions in blue were clustered into pop1 and the ones in pink were clustered into pop2.

