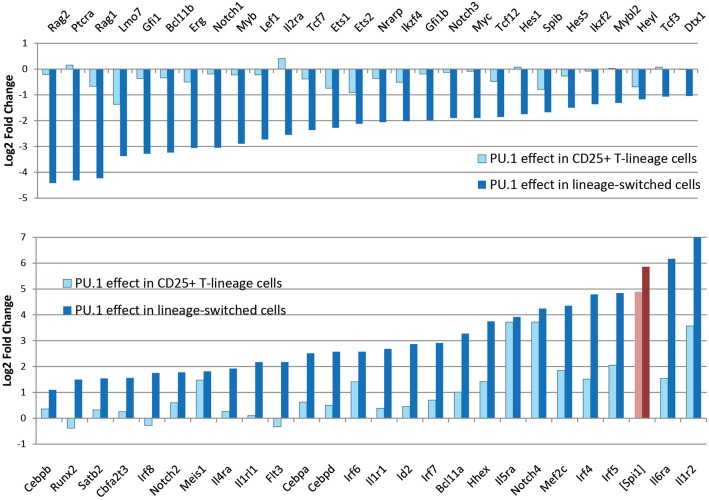
Figure 4.
Profound changes in regulatory gene expression distinguish PU.1-induced lineage deviation from PU.1 effects within the T-cell pathway. Charts show changes in expression of the indicated genes (log2 Fold Change relative to controls) induced by introduction of PU.1 into post-commitment pro-T cells (DN2b-DN3). Panels compare effects on T-lineage regulatory genes (top) and non-T regulatory and signaling genes (bottom) between cells remaining within the T-lineage pathway (light blue bars) and cells undergoing lineage deviation (dark blue bars). Light, dark red bars show corresponding measured levels of exogenous PU.1 in these samples, as log2 fold changes over controls, which have downregulated most of their endogenous PU.1 expression at this stage. Results are from Ungerbäck et al. (85).

