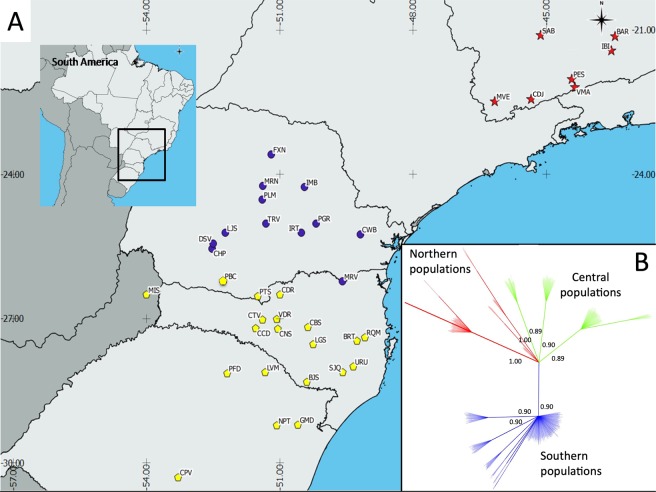
Figure 1.
(A) Overview of the sampling sites within the distribution area of A. angustifolia. Different symbols correspond to the genetic groups identified after data analysis: red stars represent populations comprising the Northern group, blue circles represent populations comprising the Central group and yellow pentagons represent populations comprising the Southern group. (B) Bayesian phylogenetic tree of the 39 populations of A. angustifolia. Red branches correspond to individuals from populations of the Northern group; green branches correspond to individuals from populations of the Central group; blue branches correspond to individuals from populations of the Southern group.

