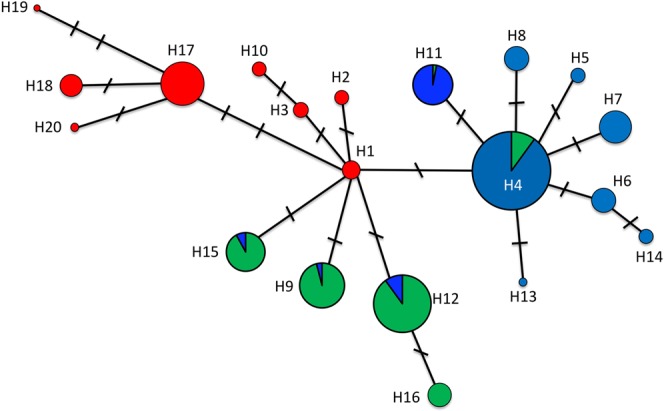
Figure 2.

Haplotype network. Red circles are haplotypes exclusive to the North group; green circles are haplotypes exclusive to the Central group; blue circles are haplotypes exclusive to the Southern group; haplotypes shared by the Central and Southern groups represent their frequency in each genetic group with the green and blue colors representing the Central and Southern groups, respectively. The sizes of the circles correspond to the frequency of each haplotype over all populations and the length of the lines is proportional to the number of mutations.
