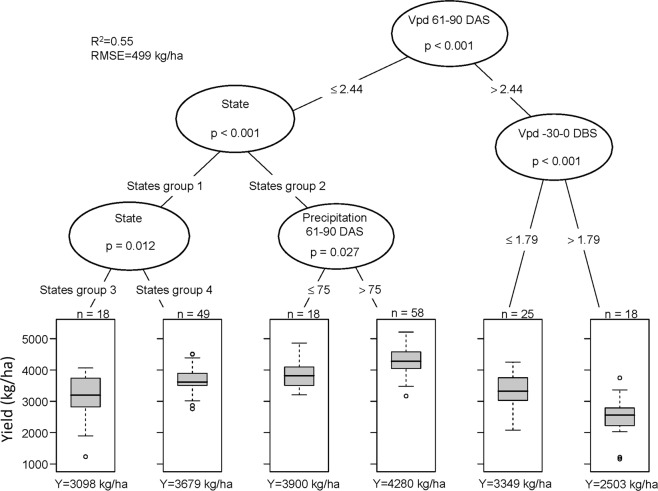
Figure 2.
Conditional inference tree for 186 US state-year soybean trial yields (kg/ha) distributed across 27 states during 2007–2016 (Fig. 1). In each boxplot, the central rectangle spans the first to third yield quartiles. The solid line inside the rectangle is the mean which is also numerically shown at the bottom (Y). The number of state-year yields (total = 186) is shown on top of each boxplot (n). The white circles show outlier yields. The acronyms DAS, DBS, and Vpd are, respectively, days after sowing, days before sowing, and vapor pressure deficit, with Vpd reported in kPa and precipitation in mm. States in group 1 include: AL, FL, GA, IA, KS, LA, MN, MO, NC, ND, OK, TN, TX, and VA. States in group 2 include: AR, DE, IL, IN, KY, MI, MS, NE, OH, PA, SD, SC, and WI. States in group 3 include: AL, GA, ND, OK, and TX. States in group 4 include: FL, IA, KS, LA, MN, MO, NC, TN, and VA. A color-coded map of the four groups is shown in Fig. S3.

