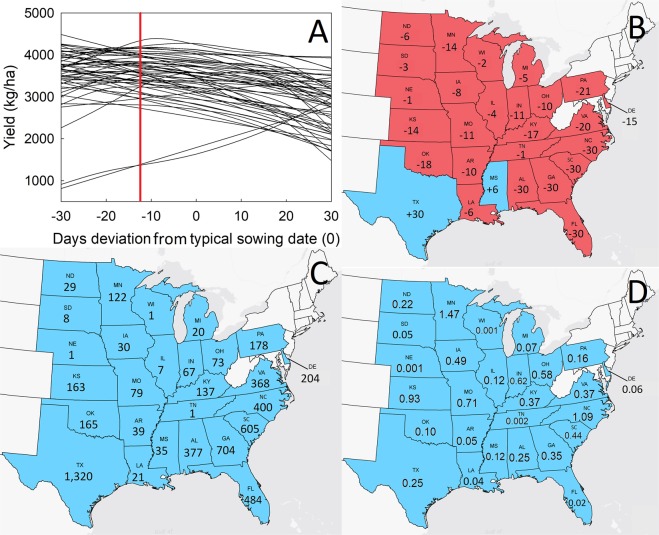
Figure 3.
Ten-year average state-specific (n = 27 States) effect (A) of sowing date on soybean yield (kg/ha) using weather data sets that differed from the typical sowing date (trials sowing date set to zero) in 10-day increments (spanning a total of −30 to +30 days). The red vertical line shows the US-average predicted optimum sowing date difference from typical. (B) Ten-year state-specific optimum sowing date difference from typical. Earlier optimum predicted sowing dates (negative numbers) were identified in red-colored states, but later than typical optimum dates (positive numbers) were identified blue-colored states. (C) Simulated 10-year average yield increase (kg/ha) when using the optimum predicted sowing dates in each state. (D) Simulated ten-year state-specific cumulative effect of optimum earlier sowing than typical when expressed in terms of soybean producer income (in 2016 inflation-adjusted Billion US$).

