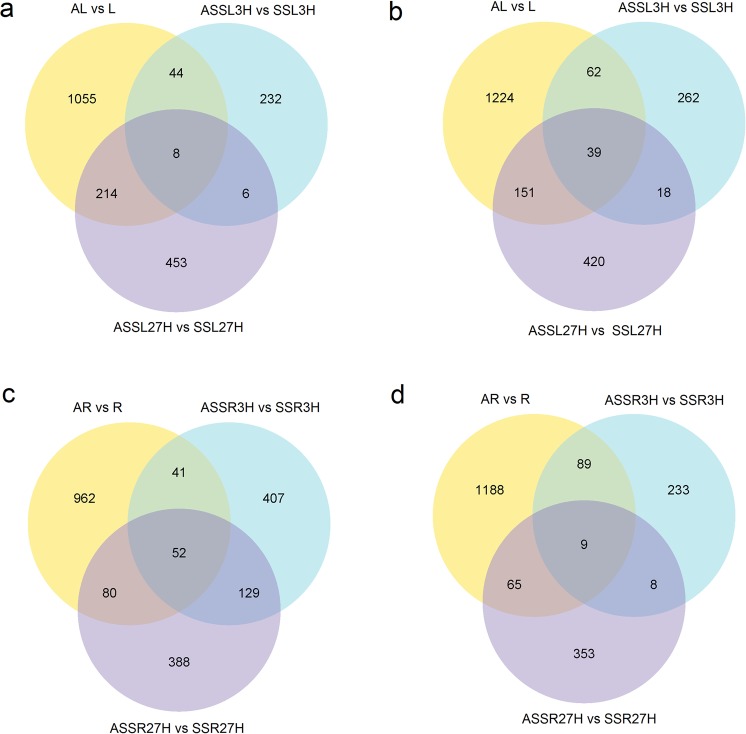
Figure 2.
Venn diagrams of differentially expressed transcripts in AM and NM plants under saline treatment in S. cannabina plantlets. (a), Numbers of DEGs exclusively upregulated in each treatment; (b), Numbers of DEGs exclusively downregulated in each treatment. The numbers of DEGs with common or opposite expression change tendencies between treatments are shown in the overlapping regions. The total numbers of up- or downregulated genes in each treatment are the sum of the numbers in each circle.

