Figure 3.

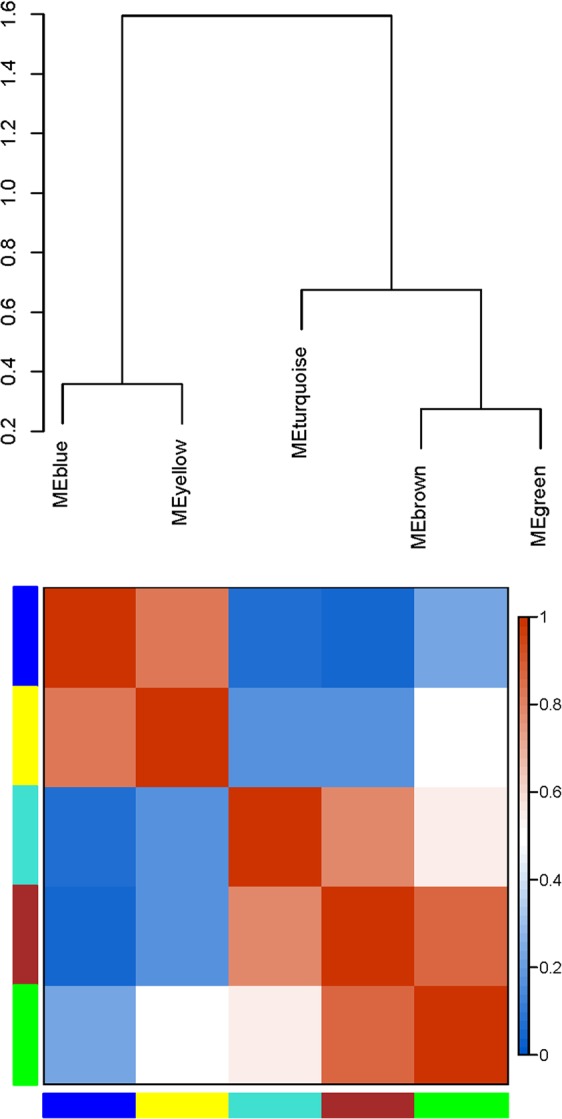
Gene co-expression modules in S. cannabina tissues showing the cluster dendrogram constructed based on the eigengenes of the modules (above) and the heatmap for the correlation coefficient between the modules (below).

Gene co-expression modules in S. cannabina tissues showing the cluster dendrogram constructed based on the eigengenes of the modules (above) and the heatmap for the correlation coefficient between the modules (below).