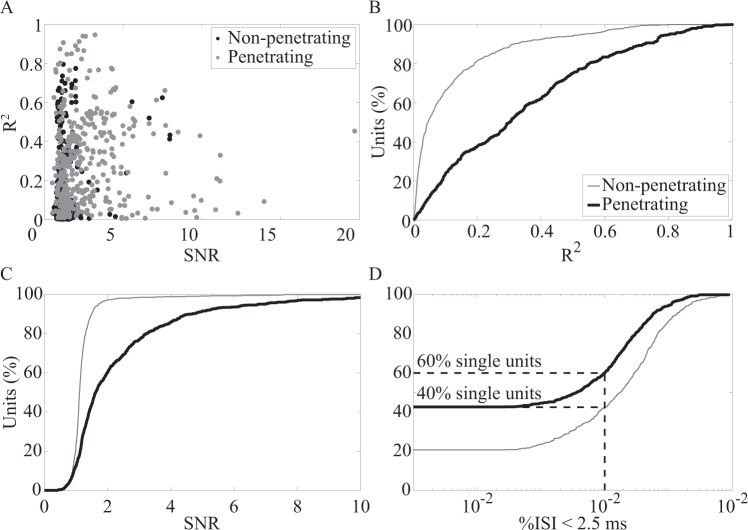
Figure 3.
Comparison of signal quality for non-penetrating and penetrating electrode arrays. (A) Scatterplot of R2 vs SNR values for each unit. Cumulative distributions of (B) R2, (C) SNR, and (D) percentage of interspike intervals (ISI) less than 2.5 ms. SNR was calculated for all units recorded from non-penetrating (thick line; n = 655 units) and penetrating (thin gray line; n = 882 units) electrodes. R2 was calculated for all units for which limb kinematic data were collected (non-penetrating electrodes, n = 623 units; penetrating electrodes, n = 366).

