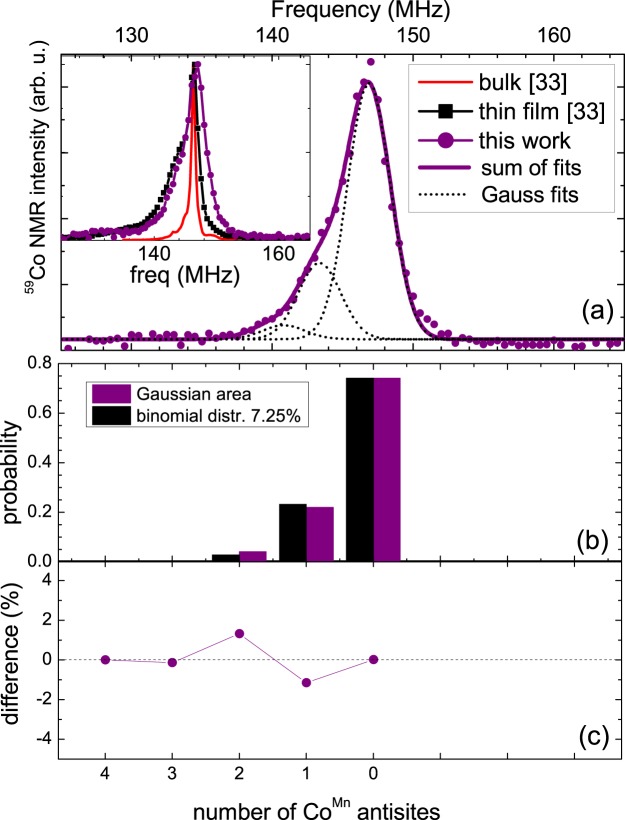
Figure 3.
(a) 59Co NMR spectra at 5 K for the non-irradiated reference sample (purple dots). Dotted lines are fits with Gaussian lines, representing the off-stoichiometry. The thick purple line is the sum of these Gaussian lines. The inset shows a comparison of the 59Co NMR spectra of the reference sample (purple dots and line), to a Co2MnSi thin film annealed at 550 °C (black squares and line) and a bulk polycrystalline Co2MnSi sample (red line)33. (b) Probability P(n, x) of the binomial distribution function for x = 7.25% (black columns) in comparison to the relative areas of the Gaussian fits to the spectrum (purple columns). (c) Difference between the relative areas of the Gaussian lines and the binomial probability.

