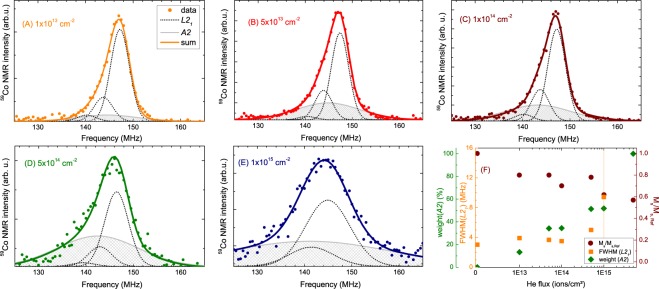
Figure 5.
(A–E) 59Co NMR spectra at 5 K for irradiated samples starting with the lowest flux of 1 × 10¹³ ions/cm2 up to 1 × 10¹⁵ ions/cm2. The corresponding fluence is written in the graphs. Lines are fits with Gaussian lines to the spectra. Dotted black lines denote the Gaussians representing the off-stoichiometric L21 ordered regions of the samples, while the filled light grey line corresponds to the A2-ordered regions of the sample. The thick line in the color of the respective data dots is the sum of all Gaussian lines. (F) Irradiation-dependent weight of the A2 structure type (dark green diamonds), FWHM of the L21 phase (orange squares), and the corresponding change in the saturation moment (dark red dots).

