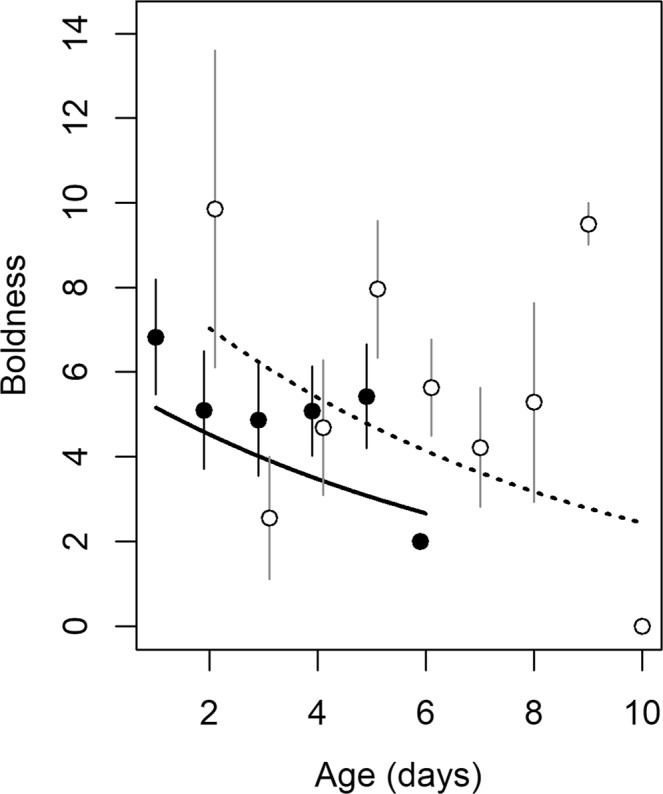
Figure 1.

Effect of age and testing sequence on boldness (N = 105 and 106 for the first and second trial, respectively). Circles show observed age- and trial-specific boldness (mean ± SE) and lines represent predicted values based on the final model. Filled circles and the solid line refer to the first trial; open circles and the dashed line to the second trial. Points were slightly jittered with regard to age. The two points for which standard error is not provided are those with N = 1.
